CRYPTO: Bitcoin - Collapses Through $68-$70 As De-Leveraging Intensifies
Bitcoin had a range overnight of $62,266.70 - $71,830.50, Asia is currently trading around $62700, -0.70%. Bitcoin has collapsed back through the $68k-$70k support and extended lower as de-leveraging picks up across the board, playing catch up to the moves in Metals. The price action looks appalling and reeks of people capitulating. So much for dipping your feet in the pool around $70k, this break now opens up a test of $50k-$55k next ahead of what many are calling the target for this move toward the $35k-$40k area. For now the bear trend is firmly back in place and rallies will likely be sold into, the first sell-zone is toward $70k-$74k and then the $80k-$85K area.
- Andy Constan on X on what he would be asking on MicroStrategy's earnings call: “ask them how they will pay the dividends and what yield are they willing to pay for the Strc. What happens to the company at a negative MNAV and unacceptable dividend yields required for issuance.”
- Niko Ludwig on X: “MSTR’s unrealized BTC profit of ~$33B has swung into a ~$4B loss. Per BTC pricing: October 6th: $126,210, Today: $67,251 (-47%)”
- The Market Ear on X: “This isn’t extreme yet — Bitcoin’s “normal” drawdown math still points to $38k.”
- Jim Bianco on X: “The $BTC carnage is accelerating. Now down 12+% today. Now the 4th worst day this decade. The other 3 were days around something "breaking." So, what is "breaking" now? Nov 9, 2022, FTX failure, Jun 13, 2022, Terra Luna Collapse, Mar 12, 2020, worst of COVID Shutdown.” See Fig Fig.1
- Bitcoin’s Average True Range(ATR) for the last 10 Trading days: $4,007
Fig 1: Bitcoin Daily Change
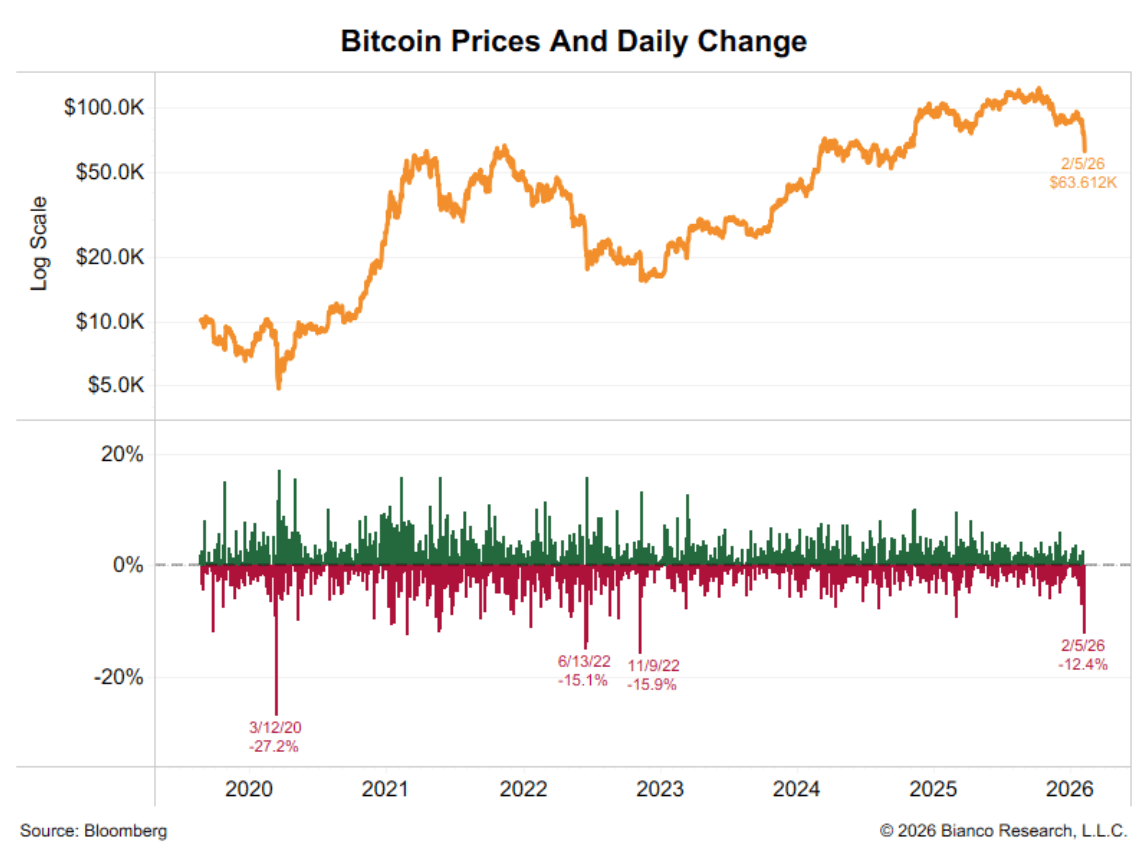
Source: MNI - Market News/Bloomberg Finance L.P/Bianco Research
Fig 1: Bitcoin spot Daily Chart
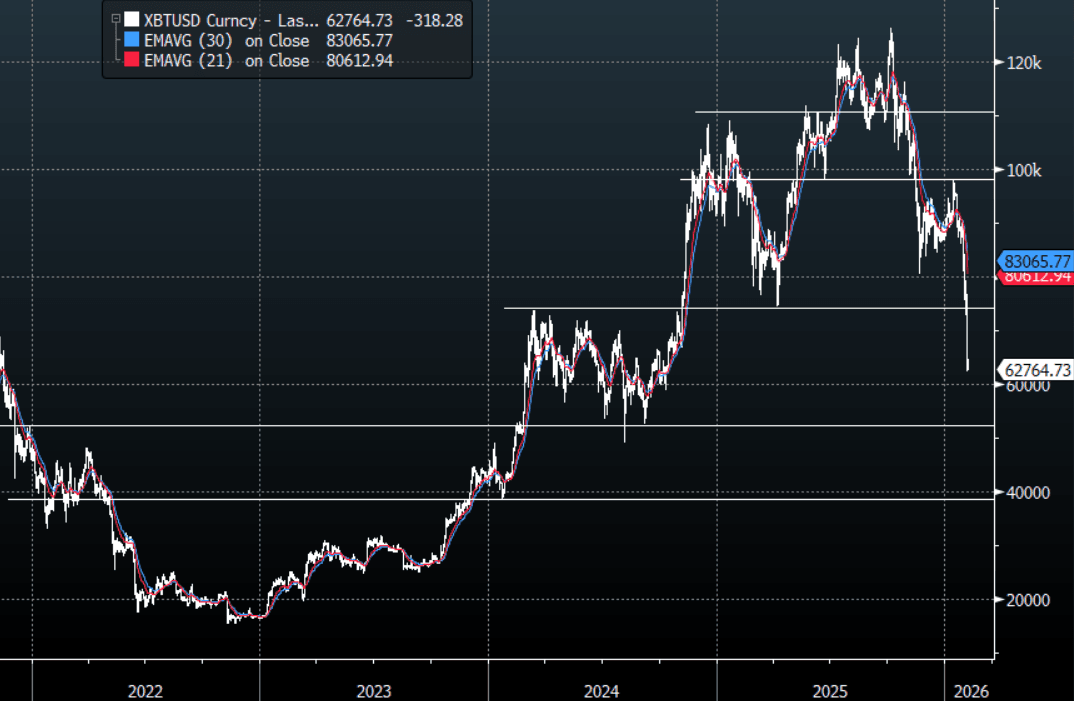
Source: MNI - Market News/Bloomberg Finance L.P
Want to read more?
Find more articles and bullets on these widgets:
Historical bullets
JGB TECHS: (H6) Shallow Bounce Off Lows
- RES 3: 140.08 - High Jun 13
- RES 2: 139.05 - High Aug 4
- RES 1: 137.30 - High Sep 8 and key short-term resistance
- PRICE: 132.09 @ 16:08 GMT Jan 6
- SUP 1: 132.03 2.0% Lower Bollinger Band
- SUP 2: 131.87 - Low Jan 5
- SUP 3: 131.22 - 1.0% 10-dma envelope
Prices traded to new pullback and cycle lows again Monday, weighed by building expectations of a BoJ rate hike cycle and a breach of support in futures prices. This affirms the firm downtrend that’s dominated prices since mid-September, and prices will need to challenge resistance before signaling any broader reversal.
AUSSIE BONDS: Consolidation In YM Works Off Oversold Condition Ahead Of CPI
After printing fresh pullback lows just before the end of 2025, the 3-year futures contract has effectively traded sideways over the past month, in the process working off its oversold technical condition.
- As a result, the contract now appears well positioned for a meaningful move in either direction should today’s CPI print deliver a material upside or downside surprise relative to market expectations.
- That said, with RBA-dated OIS pricing showing almost two 25bp hikes by December 2026, there is likely some limit to how far the market is willing to run ahead of RBA guidance.
- Nonetheless, a higher-than-expected CPI outcome would likely refocus attention on 95.480 as the next key support level in the continuous contract.
Source: Bloomberg Finance LP
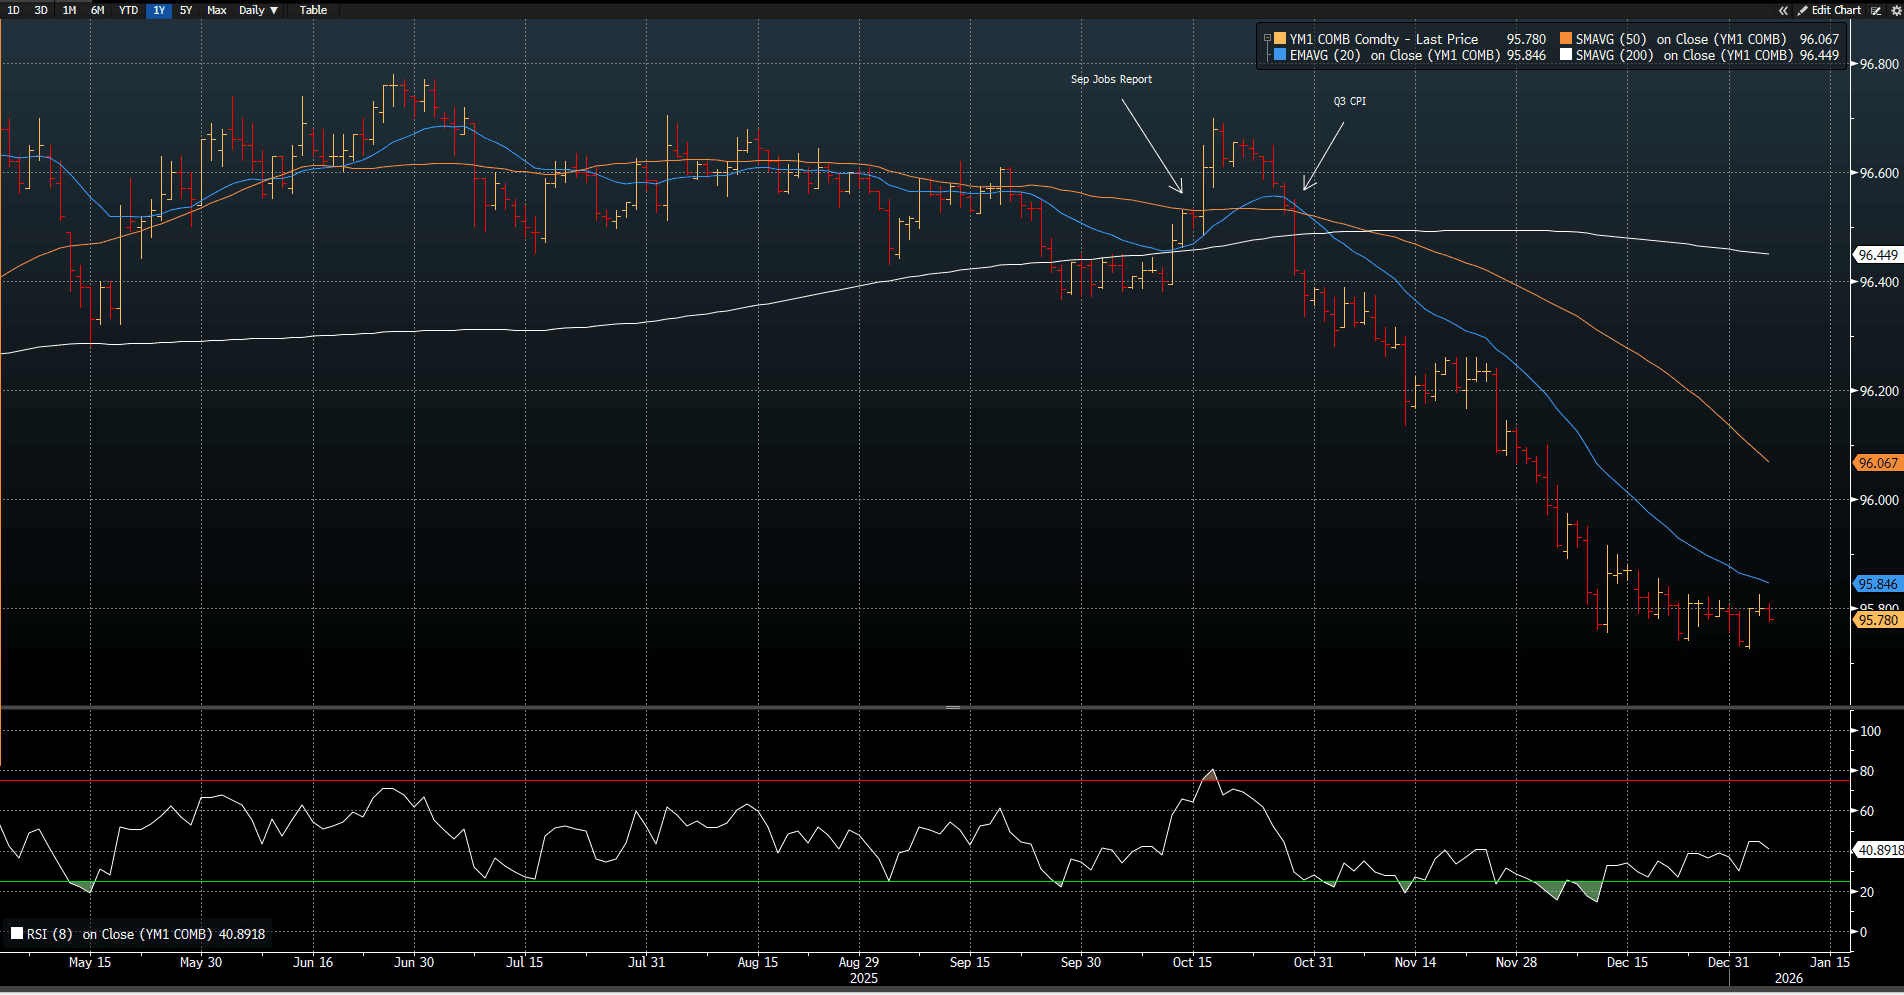
AUSSIE 10-YEAR TECHS: (H6) Marked Lower
- RES 3: 95.982 - 76.4% retracement Sep’24 - Nov’24 downleg
- RES 2: 95.960 - High Apr 7 (cont.)
- RES 1: 95.900 - High Oct 17
- PRICE: 95.170 @ 16:08 GMT Jan 6
- SUP 1: 95.120 - Low Dec 10
- SUP 2: 95.087 - 2.0% Lower Bollinger Band
- SUP 3: 94.276 - 1.0% 10-dma envelope
Aussie 10-yr futures remain well toward the bottom of the recent range, having taken out all major support levels in the process. With 95.275 cleared, prices are pushing to new contract lows, opening vol-band support through 95.087 and into 94.276. Any recoveries need to break back above 95.900 to signal near-term bullish traction.