FED: Beige Book: Economic Activity Dynamics Mixed (1/3)
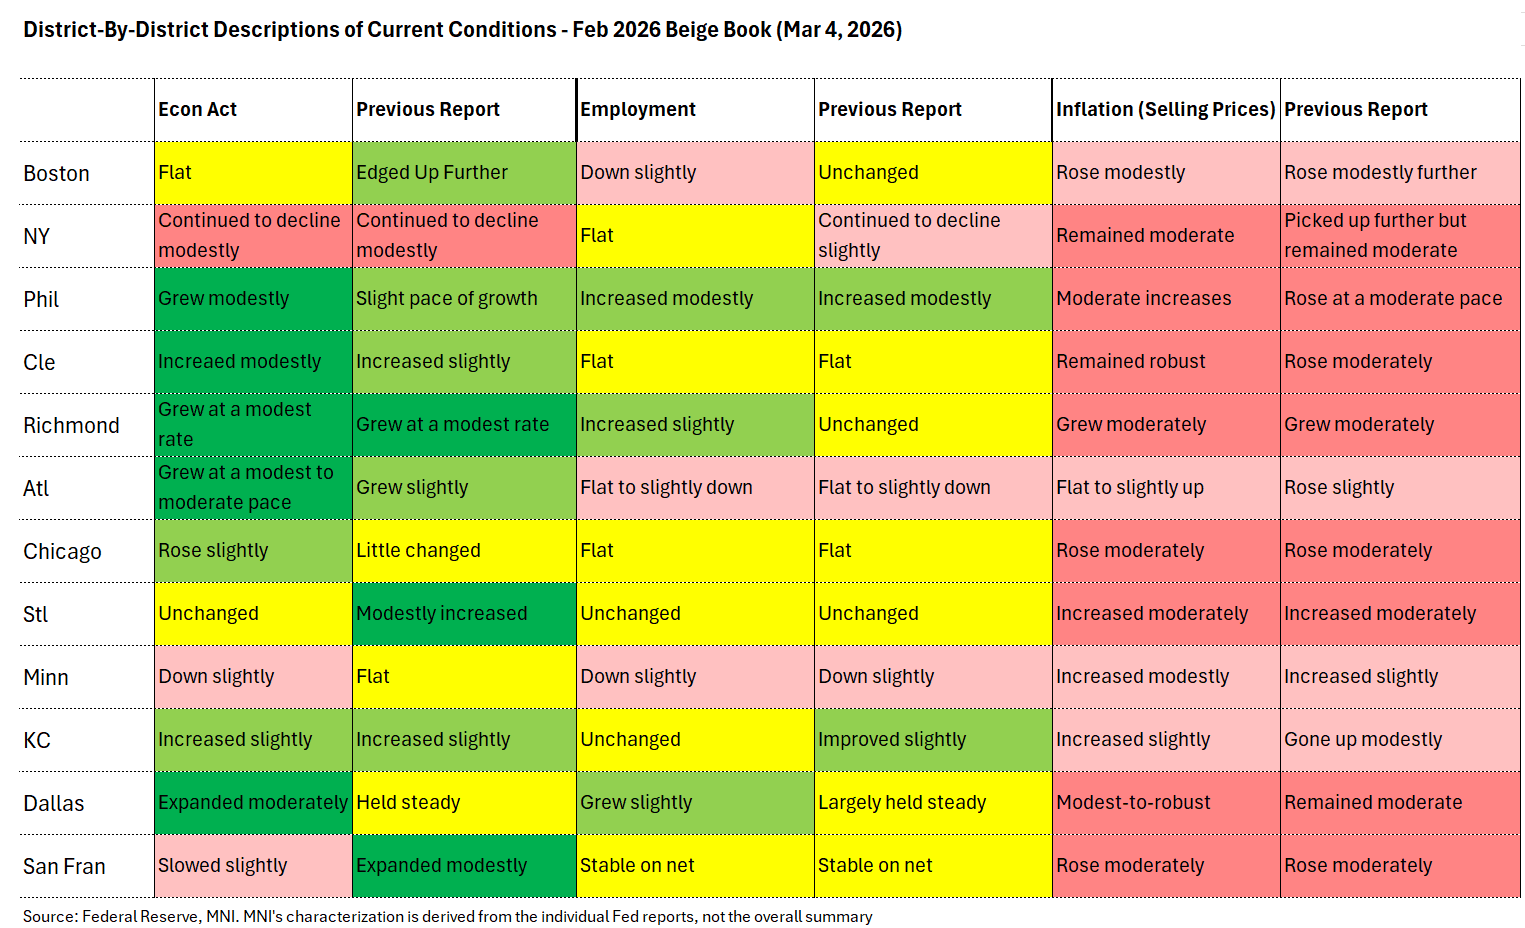
A summary of the February Beige Book (in image below) underlines only limited changes to district-by-district conditions since the previous edition (January).
- The biggest movers were in the descriptions of economic activity but they were mixed: growth worsened vs January in 4 districts (Boston, St Louis, Minneapolis, SF) though accelerated in 5 (Philadelphia, Cleveland, Atlanta, Chicago, Dallas) with 3 reporting similar dynamics as prior (Richmond, Kansas City, New York).
- Overall, 3 Feds reported outright slower activity, vs just 1 in January, with 7 reporting expansion, vs 8 previously.
- Some highlights from the Beige Book's national summary of economic activity:
- Consumer spending: "Although consumer spending increased slightly on balance, two Districts reported ongoing declines, and many noted that sales were dampened by economic uncertainty, increased price sensitivity, and lower-income consumers pulling back on spending." Auto sales were mostly down.
- Business activity: "Manufacturing activity improved overall since the previous reporting period, with eight Districts reporting varying degrees of growth and two reporting declines. Transportation activity was mixed across Districts that reported on it, with three reporting contractions and two reporting modest growth. Overall, financial services activity was reported as stable to up, with commercial lending being the primary area of strength. For most Districts that reported on residential real estate and construction, sales and activity decreased slightly, with low inventories and affordability remaining key issues. Nonresidential construction activity was mixed across reporting Districts but increased slightly on net. Among reporting Districts, agricultural conditions were mostly flat, and energy activity grew modestly on balance.
- Outlook: "Overall, economic expectations were optimistic, with most Districts expecting slight to moderate growth in the coming months."
Want to read more?
Find more articles and bullets on these widgets:
Historical bullets
US TSYS/SUPPLY: Quarterly Financing Estimates Set To Come In Largely Steady
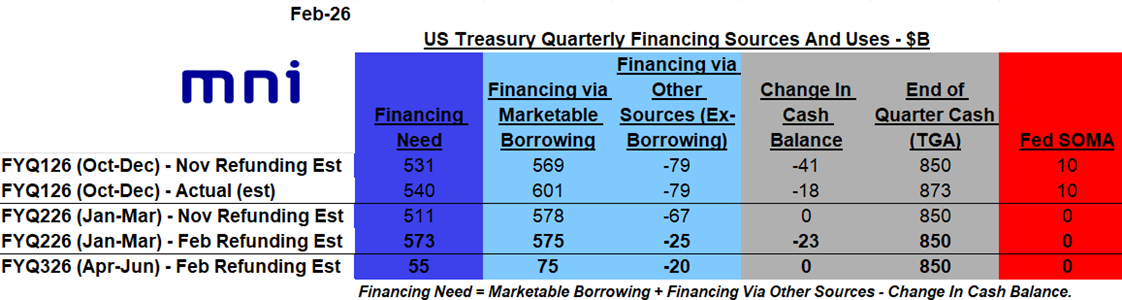
The February Refunding round starts at 1500ET today with the US Treasury’s update on financing requirements for the current (Jan-Mar) and next (Apr-Jun) quarters, at which is expected to largely maintain its borrowing projections for the current quarter.
- MNI’s expectations are in the table below. We would say that risks to our estimates are largely to the downside, i.e. Treasury expects to borrow/finance less than we have penciled in.
- Oct-Dec marketable borrowing will have been around $600B, not far from the original $569B estimate made in the November refunding round, and that is set to fall to around $575B in the Jan-Mar quarter (basically unchanged from the previous estimate; we’ve seen estimates ranging from $450-650B).
- The April-June quarter sees the lowest borrowing of the year as usual, which we estimate to come in at $75B (we’ve seen ranges from slightly negative, to over $200B).
- These figures assume that Treasury continues to target a $850B end-quarter TGA cash pile.
- Below are some sell-side expectations.
- CIBC: $640B borrowing requirement Jan-Mar, $96B Apr-Jun (assuming $850B end-quarter TGA).
- Deutsche: Net borrowing of $555B in Jan-Mar, $25B in Apr-Jun (assuming $850B cash end quarter TGA).
- Goldman Sachs: marketable borrowing of $640bn for Q1. Assuming a $850bn TGA target, for Q2 expect marketable borrowing of $290bn
- JPMorgan: $498B in marketable borrowing in Q1, $102B in Q2, assuming $850B TGA
- TD: $561bn in marketable borrowing for Q1 and $19bn in Q2. We assume a TGA target at $850bn for both quarters.
- Wells Fargo: Marketable borrowing $609B in Q1, $228B in Q2
US: FED Reverse Repo Operation
RRP usage inches up to $10.415B with 8 counterparties this afternoon vs. $9.629B Friday. Compares to December 12 low of $0.838B (lowest level since mid-March 2021); this years highest excess liquidity measure: $460.731B on June 30.
EURGBP TECHS: Key Support Remains Exposed
- RES 4: 0.8813 76.4% retracement of the Nov 14 - Jan 6 bear leg
- RES 3: 0.8797 High Dec 17
- RES 2: 0.8781 61.8% retracement of the Nov 14 - Jan 6 bear leg
- RES 1: 0.8708/46 50-day EMA / High Dec 31 & Jan 21
- PRICE: 0.8650 @ 16:11 GMT Feb 2
- SUP 1: 0.8644 Low Jan 6 and the bear trigger
- SUP 2: 0.8633 Low Sep 15
- SUP 3: 0.8620 38.2% retracement of the Dec ‘24 - Nov ‘25 bull cycle
- SUP 4: 0.8597 Low Aug 14
EURGBP is trading closer to its recent lows. A bear threat remains intact and recent weakness signals the end of a corrective phase between Jan 6 - 21. MA studies are in a bear-mode set-up and this highlights a dominant bear cycle. Key support and the bear trigger lies at 0.8644, the Jan 6 low. A break of this level would confirm a resumption of the trend and open 0.8620, a Fibonacci retracement. Key resistance is 0.8746, the Jan 21 high.