JGBS: Back From Early Highs, BoJ Due
JGB futures have traded as a function of broader core fixed income gyrations, bid on the re-open on the aforementioned Pentagon worry re: the potential for Russia to deploy nuclear threats if the Ukraine conflict drags on, before fading back from best levels as some in the Asia-Pac region played down the likelihood of such a move and reacted to the start of the re-opening of manufacturing capacity in the Chinese city of Shenzhen. Futures hit the lunch break -7 vs. yesterday’s settlement, while cash JGBs sit within -/+0.5bp of settlement levels.
- Elsewhere, CPI data was largely inline with expectations, with the BoJ’s preferred core measure running at a meagre +0.6% Y/Y in February. A reminder that headline inflation dynamics are set to be driven by energy price & JPY movements in the coming months. This is the sort of cost push inflation that the BoJ will look through, given relatively limited wage growth & little in the way of demand pull-linked inflation. This upcoming BoJ decision is expected to be a bit of a non-event, with Governor Kuroda set to re-affirm the need for continued easing given the previously outlined inflation dynamic (see our preview of that event for more detail)
Want to read more?
Find more articles and bullets on these widgets:
Historical bullets
EQUITIES: Shift in Techs, Sentiment Point to Potential Equity Reversal
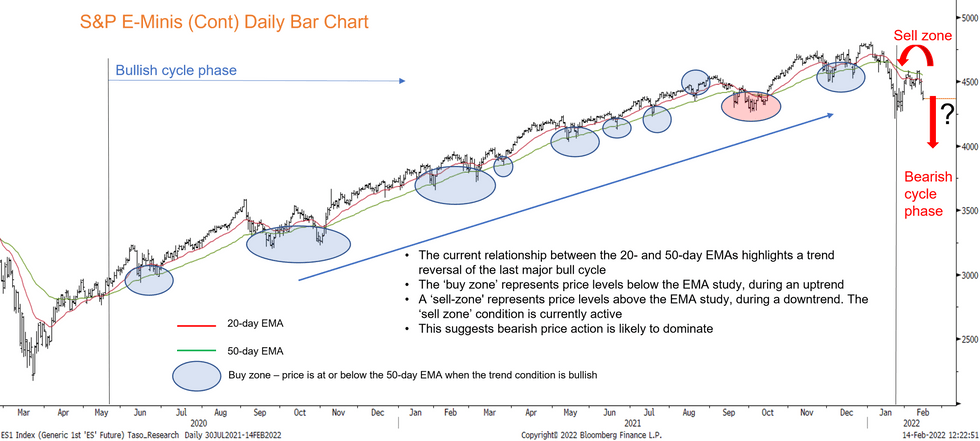
Executive Summary
- A shift in the equity trend condition may suggest the uptrend in stocks has reversed this year
- Technical trend condition has shifted from bull phase to a bearish signal
- With a rising number of economic and sentiment indicators pricing in a significant deceleration in economic activity, Fed may disappoint by delivering fewer hikes than the market is currently expecting
S&P 500 Trend Indicators Flag A Broad Reversal In Sentiment
The E-Mini S&P 500 has been in an uptrend since Mar 23 2020. Since early January, however, a shift in the trend condition appears to have occurred that suggests the uptrend has reversed. The sharp sell-off in January has resulted in a key trend indicator reversing from a bull mode condition to a bearish one and price activity in February has reinforced this trend warning.
These technical signals coincide with a number of economic indicators pricing in a significant deceleration of economic activity in the US, leaving a number of asset classes - and most notably US equities - at risk ahead of a prolonged Fed tightening cycle.
Full piece on US macro indicators here:
In 2021, we highlighted, on a number of occasions, the relationship between the following trend elements:
- The set-up between the 20- and 50-day exponential moving averages (EMAs) and the role these two averages perform in highlighting market sentiment.
- When a market is trending up, the two EMAs allow one to assess where on the chart, demand interest is likely to appear that will ultimately result in rising prices and a resumption of the uptrend - we use the term ‘buy-zone’. In a downtrend a ‘sell-zone’ is the relevant condition for trend purposes - areas on the chart where selling interest is likely to limit price gains.
In the chart below, the uptrend since Mar 2020 is clearly highlighted. A ‘buy-zone’ represents the price level on the chart at or below the 50-day EMA. In each of the corrective pullbacks during this major uptrend, demand for the contract, when price traded below the 50-day EMA, eventually delivered reversal of the preceding correction and importantly a resumption of the uptrend as price climbed to fresh cycle highs. During this bull cycle, the 20-day EMA remained above its 50-day counterpart. The only exception was for a brief period in October 2021. During this correction, price however quickly recovered from its lows in Sep / Oct to resume the uptrend.
The EMA condition has changed and it appears that this contract has moved from a bull cycle phase to a bearish one.
Source: Bloomberg/MNI
The key factors to note are:
- The set-up between the 20- and 50-day EMAs is bearish - a clear crossover has occurred following strong selling pressure in January.
- Price has recently recovered from its low of 4212.75 on Jan 24.
- This recovery however appears to be a correction and more importantly stalled at 4586.00 on Feb 2. The failure at 4586.00 is important because:
- It highlights a failure above the 50-day EMA.
- The EMA condition is bearish and price levels above the 50-day average highlight a ‘sell-zone’.
- This means the ‘sell-zone’ condition is active and has restricted an appreciation in price.
- A move below 4212.75, Jan 24 low would complete the ‘sell-zone’ requirement, confirm a resumption of this year's downtrend and importantly reinforce the conditions of a medium-term bearish cycle.
- This would highlight potential for weakness below 4200.00 initially and also leave the 4000.00 handle exposed.
The confirmation of a downtrend and an active ‘sell-zone’ condition suggests that a deeper retracement of the last major bull cycle is possible. Fibonacci retracements flag 3801.97 as a level to watch should 4000.00 give way. This is the 38.2% retracement of the Mar 2020 - Jan 2022 bull phase.
To offset the bearish threat, price needs to initially confirm a convincing break of the 50-day EMA and set-up a challenge of this year's high at 4808.25 on Jan 4. Until then, a continued retracement of the last major bull cycle appears likely as market sentiment remains bearish.
US TSYS: Light Richening In Asia
Tsys have experienced some marginal richening in Asia dealing, with regional participants willing to buy Tuesday’s dip. Outright yield levels, questions re: the potential for further short-term hawkish Fed re-pricing, downside misses in the latest round of Chinese inflation data and questions in the West re: the apparent de-escalation in the Russia-Ukraine standoff (punctuated by U.S. President Biden’s continued alert re: the potential for a Russian invasion of Ukraine) are likely fostering the bid. Cash Tsys run 1.5-3.0bp richer across the curve, with the front end leading, facilitating some bull steepening. TYH2 prints at fresh session highs, +0-05 at 125-28+.
CNH: Inflation Slowdown
The reaction of spot USD/CNH to Chinese inflation figures for the month of January has been rather muted, with the pair grinding higher since earlier this morning. It last operates at CNH6.3391, up 25 on the day.
- Following a breach of Feb 4 low of CNH6.3489 on Tuesday, bearish focus moves to CNH6.3238, a cycle low printed on Jan 26. Bulls set their sights on Feb 8 high of CNH6.3763, followed by Jan 31 high of CNH6.3864.
- Both consumer and factory gate price growth slowed more than forecast, providing the PBOC more room to ease policy if needed. Headline CPI rose 9.1% Y/Y (BBG median: +9.5%), with PPI up 0.9% (BBG median: +1.0%).
- Chinese President Xi ordered Hong Kong to use "all necessary measures" to bring its outbreak of Covid-19 under control. Wen Wei Po reported that he asked the city's government to make tackling Covid-19 its main priority.
- The Chinese data docket is virtually empty during the remainder of this week. Focus turns to LPR fixing & new home prices, due next Monday.