JAPAN DATA: Aug Inflation Close To Forecasts, Core- Ex Fresh Food/Energy, Sticky
Japan August national inflation was close to market forecasts. The headline rose 2.7%y/y, 2.8% was forecast (prior 3.1%). The core ex fresh food measure was up 2.7%y/y, in line with market expectations (prior was also 3.1%). The ex fresh food, energy measure was 3.3%y/y, also in line with forecast and down a touch on the 3.4% July outcome.
- In terms of the m/m outcome, headline was up 0.1%, ex fresh food was flat, while ex fresh food and energy rose 0.3%m/m. Goods prices were up 0.1%m/m while services rose 0.2%, although often the service print gets revised. In July it was originally reported that services were up 0.1%m/m, but the outcome is now back to flat.
- The main drop in the month came from the 4.2% decline in utility prices (as energy subsidies impacted). Clothing, down -0.7%m/m (the fourth straight decline) was the other soft point. Elsewhere though most categories were close to July outcomes or higher. Notably entertainment was up 1.8%m/m, after a 0.8% July gain. Fresh food rose 3.3%m/m as well, after a period of extended falls.
- In y/y terms, we didn't see strong shifts relative to July, outside of utilities dropping to -4.0%y/y (from -0.2%). Services prices were up 1.5% for the third month in a row.
- We have the BoJ meeting later today. No change is expected. Today's inflation update is unlikely to shift thinking dramatically in terms of the broader BoJ inflation outlook.
Fig 1: Japan CPI Trends Y/Y - Core Ex Fresh, Energy Still Sticky Above 3%
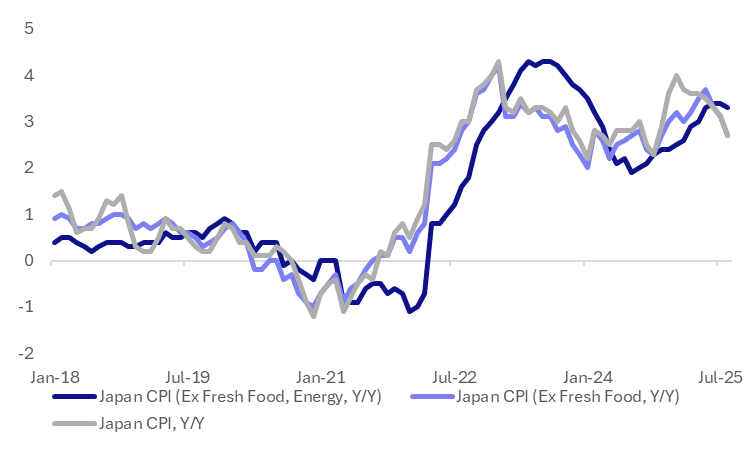
Source: Bloomberg Finance L.P./MNI
Want to read more?
Find more articles and bullets on these widgets:
Historical bullets
MNI: MNI JAPAN JUNE CORE MACHINE ORDERS +3.0% M/M; MAY -0.6%
- MNI JAPAN JUNE CORE MACHINE ORDERS +3.0% M/M; MAY -0.6%
- JAPAN JUNE MACHINE ORDERS POSTS 1ST M/M RISE IN 3 MONTHS
MNI: JAPAN JULY EXPORTS -2.6% Y/Y; JUNE -0.5%
- MNI: JAPAN JULY EXPORTS -2.6% Y/Y; JUNE -0.5%
- JAPAN JULY EXPORTS POST 3RD STRAIGHT Y/Y DROP
ASIA STOCKS: South Korea, Taiwan See Outflows, Indonesia & India See Inflows
South Korea and Taiwan markets saw outflows from offshore investors yesterday. For Taiwan the nearly $500mn in outflows was the largest since July 29. For both markets, the 5 day sum is negative. Broader tech equity weakness continued in Tuesday trade. There has been some concerns voiced around the AI outlook recently, while proximity to Fed Chair Powell's speech this Friday may also be driving some nervousness in terms of broader market trends.
- Elsewhere we saw offshore investors return to India at the start of the week, with the recent equity bounce (aided by potential GST changes) drawing in some inflows. Still, cumulative outflows since the start of July were close to $4.7bn, so momentum needs to meaningful shift in order to bring us closer to neutral from a Q3 standpoint.
- Indonesian flows remained positive, while weaker trends were evident elsewhere in South East Asia. Malaysia continued its outflow streak.
Table 1: Asian Markets Net Equity Flows
| Yesterday | Past 5 Trading Days | 2025 To Date | |
| South Korea (USDmn) | -298 | -238 | -5146 |
| Taiwan (USDmn) | -491 | -240 | 4046 |
| India (USDmn)* | 116 | -582 | -12721 |
| Indonesia (USDmn) | 53 | 277 | -3280 |
| Thailand (USDmn) | -13 | -273 | -1969 |
| Malaysia (USDmn) | -18 | -141 | -3408 |
| Philippines (USDmn) | -21 | -7 | -620 |
| Total (USDmn) | -671 | -1203 | -23098 |
| * Data Up To Aug 18 |
Source: Bloomberg Finance L.P./MNI