US DATA: A Mixed But Ultimately Healthy Claims Report, With Unusual Revisions
Jan-29 14:16
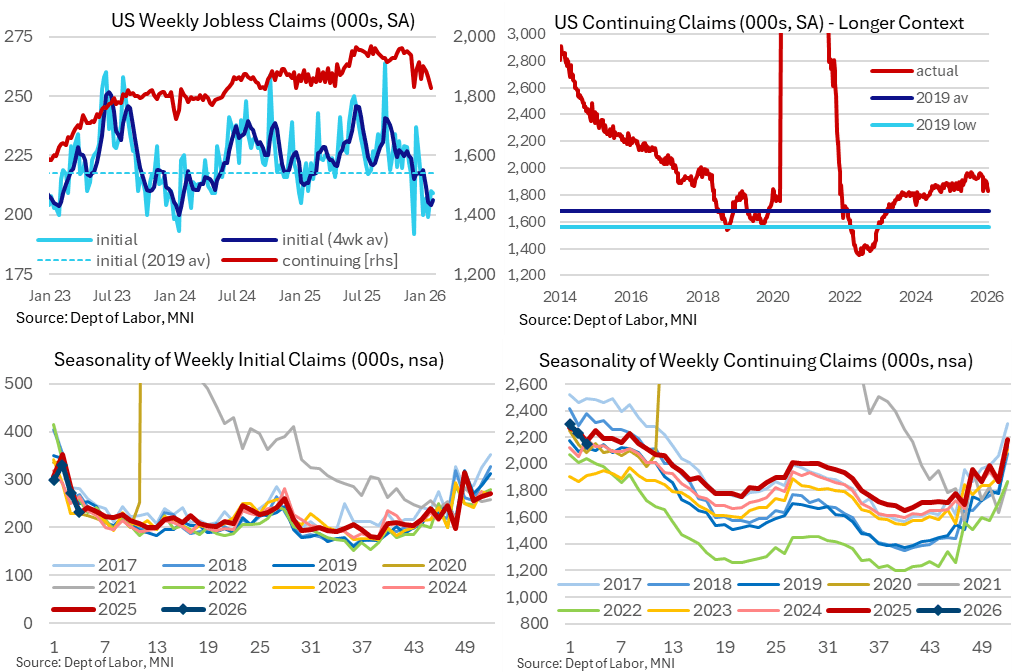
- Initial jobless claims were a little higher than expected at 209k (sa, cons 205k) in the week to Jan 24, having last surprised higher in the week to Dec 6.
- It left initial claims almost unchanged on the week after an unusually large upward revision to 210k (initial 200k, revisions typically closer to 1-2k) in the week to Jan 17. The 13k upward revision in the NSA data primarily came from California (+5.6k), Kentucky (+3.6k) and Michigan (+2.4k).
- This 210k is still favorable compared with prior payrolls reference periods such as 224k in Dec, 222k in Nov, 231k in Oct and 232k in Sep.
- The four-week average is also still historically low, rising 2k to 206k for comfortably below the 2019 average of 218k, but with what looks like residual seasonality that points to increases heading into February (see top left chart).
- As we often note, that 2019 average came with a sub-4% u/e rate although re-hiring is clearly softer compared to 2019 with continuing claims levels chiming with an u/e rate more firmly in the 4s.
- That said, continuing claims pushed lower again to ‘just’ 1827k (sa, cons 1850k) in the week to Jan 17 below the 1830k in Nov for its lowest since Sep 2024.
- It follows an upward revised 1865k (initial 1849k) in the week to Jan 10, also an unusual revision as we can only recall seeing an upward revision twice in the whole of 2025 (early Jan and late Sep). Of the 19k upward revision in NSA data, 20k came from California, 9k from Puerto Rico, 5k from Florida along with -7.5k from Washington, -5k from Minnesota, -4k from Oregon.
- The rare upward revision poses more two-sided risk to next week’s revision for the Jan 17 data, corresponding with the payrolls reference period, rather than the almost ever-present downward revisions. Still, at 1827k before any revisions, it looks particularly favorable vs 1914k for Dec, 1944k in Nov, 1957k in Oct, 1916k in Sep and 1944k in Aug.
- Whilst it's possible that continuing claims are pushing lower as unemployment insurance will have been exhausted under regular state programs, JPMorgan analysis of monthly detailed data suggests this isn’t the sole factor.
Want to read more?
Find more articles and bullets on these widgets:
Historical bullets
US DATA: Redbook Retail Sales On Track For Best Y/Y Gains Since 2022
Dec-30 14:03
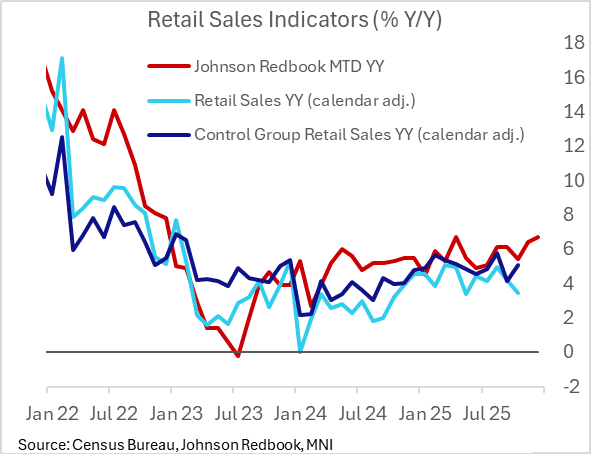
The latest Johnson Redbook retail sales index showed growth of 7.6% Y/Y in the week ending December 27, an acceleration from 7.2% prior. That brought month-to-date sales to 6.7% Y/Y with one week remaining on December's retail calendar (Jan 3), above retailers' targeted 6.5% and November's 6.4%. Indeed if the pace is maintained that would mark the joint-highest reading since December 2022 (April 2025 also posted 6.7%).
- While in nominal terms, that's suggestive of a solid end of the year for control retail sales, suggesting little let-up in PCE gains in Q4 (Q3 overall real PCE grew 3.5% Q/Q SAAR, with Goods PCE up 3.1%). The Atlanta Fed's currently nowcasting a 2.7% gain in Q4.
- We won't get the official Census Bureau retail sales data for December until an as-yet undetermined date; the November report is due out January 14.
- The anecdotes suggested strong consumer activity just before and after Christmas on the 25th: "Sales accelerated, with higher traffic counts in the days leading up to Christmas. Retailers reported most business occurred on the 24th—especially in groceries, jewelry, beauty, and home furnishings. After Christmas, traffic remained high as consumers exchanged and returned gifts, redeemed gift cards, searched for last-minute presents, and hunted for bargains. Retailers observed less return traffic as people researched purchases and adhered to budgets. More consumers, particularly young people influenced by social media and financial strain, are visiting thrift stores to find unique items and vintage designer brands, driven by sustainability concerns and the appeal of new shopping experiences."
MNI:US OCT FHFA HPI SA +0.4% V -0.1% SEP; +1.7% Y/Y
Dec-30 14:00
- MNI:US OCT FHFA HPI SA +0.4% V -0.1% SEP; +1.7% Y/Y
MNI: US REDBOOK: DEC STORE SALES +6.7% V YR AGO MO
Dec-30 13:55
- MNI: US REDBOOK: DEC STORE SALES +6.7% V YR AGO MO
- US REDBOOK: STORE SALES +7.6% WK ENDED DEC 27 V YR AGO WK