SOUTH KOREA: 2s10s Curve Update
- The steepening of the curve had taken a breather leading up to the BOK meeting this week having reached +48 late last week.
- After a year high of +51bps in early June, the 2s10s curve differential had backed off to +35bps by the end of June before issuance led-steepening in August.
- Following the BOK no change this week, the curve stands at +45
- Next week is a big week for data with exports, PMI Manufacturing, CPI and 2Q GDP preliminary.
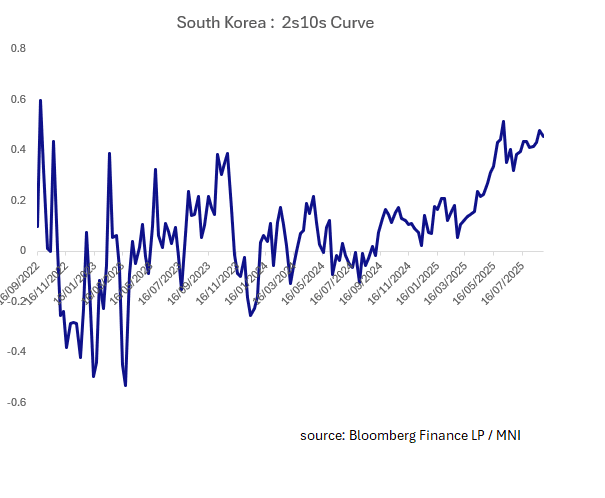
- The Korean bond market has the highest correlation to the US bond market according to our analysis. The UST 10s2s steepening began at the start of April when the US curve started to move.
- The Korean curve could start to re-calibrate growth expectations for 2025, particularly with today's announcement from the Korean Government.
- Current forecasts suggest a mere +1.0% GDP growth for 2025 as South Korea’s new government plans a significant increase of its annual budget to revive an economy under pressure from US tariffs, rising welfare costs and an aging population.
- The proposed budget for 2026 is an +8.1% increase and includes ramped-up defense spending and aims to spur an “economic transformation” by channeling support into sectors including artificial intelligence, semiconductors, shipbuilding and K-culture.
- The government plans to issue a record amount of bonds to fund the government spending and will target technology-driven growth, stronger small businesses and more balanced regional development.
- In 2020 the COVID impacted budget resulted in a deficit of -2.7% and GDP growth the following year of 4.6%. The deficit for 2024 was -3.4% with a skew towards the back end of the year. The 2025 budget forecast increase and would be two meaningful deficits in two years for the first time in some time following 2024's deficit of -3.4%.
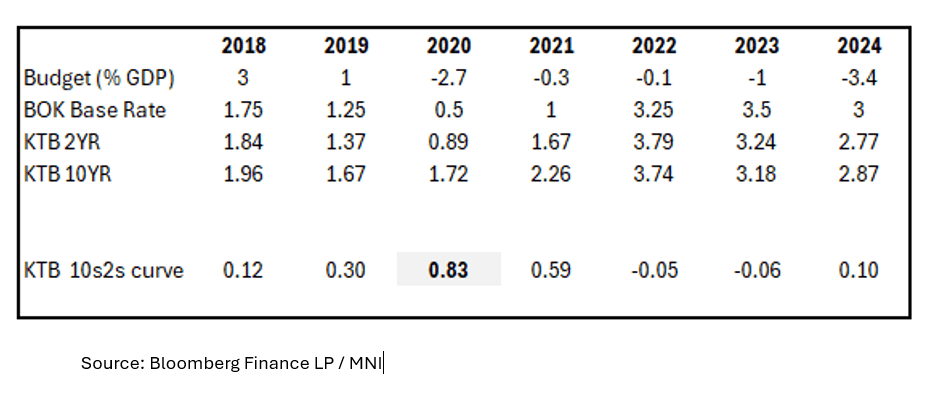
- Looking back at 2020, the curve finished the year end at 0.83 as the COVID economy required significant budget spend. It then moved higher again in early 2021 before trending lower.
- This could suggest potential steepening to occur in Q3 for 2025 for KTBs as growth is recalibrated. Additionally, if the BOK were to cut one more time (as some market observers are suggesting) when combined with supplementary budgets, the impact on growth could be meaningful.
Want to read more?
Find more articles and bullets on these widgets:
Historical bullets
BOJ: MNI BoJ Preview - July 2025: Focus On Presser After Trade Deal
EXECUTIVE SUMMARY
- The two-day Bank of Japan (BoJ) policy meeting concludes on 31 July, with the central bank set to release its quarterly “Outlook for Economic Activity and Prices”, its monetary policy statement, and hold a press conference with Governor Kazuo Ueda.
- The BoJ is widely expected to keep its policy rate unchanged at 0.5% for a fourth consecutive meeting, amid signs of easing trade-related uncertainty since its June meeting.
- Most analysts continue to expect the next rate hike to occur in late 2025 or January 2026. However, timing remains fluid.
- Markets will pay close attention to Governor Ueda’s tone during the post-meeting press conference. Ueda has maintained a cautious stance since May, but if the forecasts and risk assessments are revised higher, there’s a high likelihood his tone may shift.
- However, with OIS markets pricing in a 65% chance of a 25bp rate hike by end-2025, the bar for a hawkish surprise is high. As a result, even a mild shift in tone could be interpreted as dovish, relative to expectations.
- Full preview here
AUSTRALIA DATA: Complete Monthly CPI In November, June Prints Around 2%
The RBA has been reluctant to rely on the monthly CPI series as it only covers around two thirds of the quarterly index. However, in November the ABS will move to a complete monthly CPI for the October release which will run alongside the quarterly series until full seasonal adjustment factors are included. In June, the current trimmed mean CPI moderated to 2.1% y/y from 2.4% in May, the lowest since August 2021, and headline to 1.9% from 2.1%.
Australia monthly core CPIs y/y%
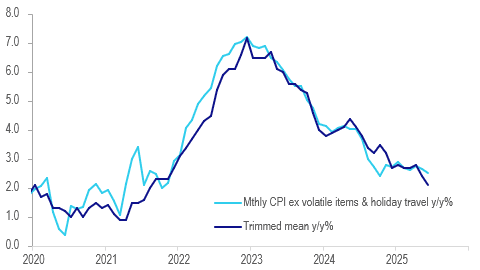
Source: MNI - Market News/ABS
- Another measure of underlying inflation, CPI ex volatile items & holiday travel, continued to run above the trimmed mean at 2.5% y/y but did moderate from 2.7% in May. However, June remained above the 2024 low of 2.4% and the 3-month annualised rate is 3.8%.
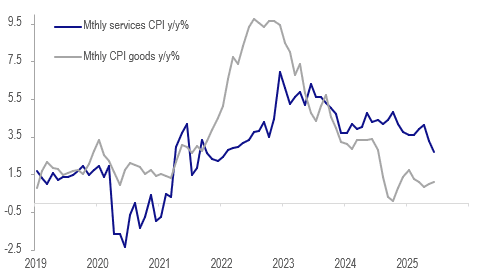
- Services and non-tradeables also moderated in June to 2.7% y/y and 2.8% y/y respectively. Services is its lowest since January 2022’s 2.4%.
- Goods inflation was steady at 1.1% and tradeables remained flat on the year.
Australia monthly goods vs services CPIs y/y%
AUSTRALIA DATA: Core Inflation Moderating Towards Band Mid-Point
Australia’s Q2 trimmed mean CPI printed only 0.1pp above the RBA’s May Q2 forecast, which with the economy developing broadly in line with expectations since the July meeting should allow it to ease 25bp on August 12 when it also releases its updated outlook. Trimmed mean rose 0.6% q/q to be up 2.7% y/y, a moderation from Q1’s 0.7% & 2.9%.
Australia CPI y/y%
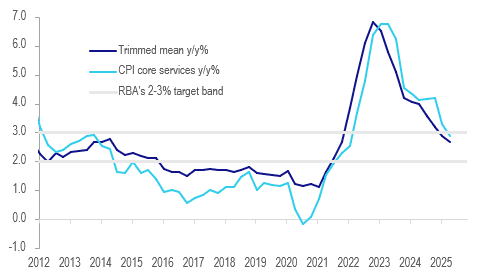
Source: MNI - Market News/LSEG
- The RBA assumed another 50bp of easing in H2 2025 in its May projections which resulted in underlying inflation close to the band mid-point at 2.6% in Q4. The Q2 CPI data should give the Board confidence that this can be achieved resulting in 25bp of that easing in August.
- Importantly services inflation continued to moderate after its 2024 stickiness. In Q2 it fell 0.4pp to 3.3% y/y while core services eased 0.4pp to 2.9%, the lowest since Q1 2022 and within the band, due to easing rental and insurance inflation. Non-tradeables was more stable at 3.1% y/y (-0.1pp). The RBA should be reassured that domestically-driven inflation is finally contained.
- Goods and tradeables inflation remain low and moderated further to 1.1% y/y (-0.2pp) and 0.2% y/y (-0.7pp) respectively.
- Headline CPI, which is still distorted by government electricity rebates, rose a less-than-expected 0.7% q/q and 2.1% y/y after 0.9% & 2.4% in Q1.
- The ABS cites housing as one of the main drivers of the quarterly CPI increase. It rose 1.2% q/q due to electricity prices +8.1% q/q due to rebates being used in Q1. Electricity is still down 6.2% y/y.
- Annual new dwelling and rental inflation continued to moderate at 0.7% and 4.5% respectively.
- Food prices rose 1.0% q/q due to fruit & veg +4.3% q/q. Health rose 1.5% q/q driven by annual insurance increase.
- Transport fell 0.7% q/q due to lower global crude driving auto fuel prices down 3.4% q/q.