FOREX: USD Index Pinned to 50-dma as Putin Shakes Hands with Trump
- USD slipped against all others Friday, with a poor set of retail sales and Uni of Michigan sentiment numbers meeting a higher-than-expected import price index to further stimulate concerns over a stagflarionary phase in the US economy. The USD Index trades either side of the 50-dma which, notably, has begun to flatten out after maintaining a solid downtrend throughout 2025.
- JPY is the strongest currency in G10, extending the breakout and bearish conclusion of the consolidation phase in USD/JPY. Recent weakness puts the price through support drawn off the early August lows as well as 146.71, a key retracement. Price action this week marks a full reversal of the previously overbought condition, keeping the downside argument in focus.
- Anticipation ahead of the Putin-Trump meeting has reached fever pitch. Footage showing the Presidents shaking hands in Alaska has helped ease concerns over a hostile meeting, but it's the outcomes that will matter to markets - particularly as equities hold at alltime highs. Any signs of progress toward a ceasefire would be warmly received by risk sentiment - although both Trump and Putin cautioned against a optimistic outcome in comments to press.
- We noted earlier in the week the pressure building on USD/HKD, with price action not matching the pattern of HKMA intervention. That move extended overnight, and is still building at typing, putting spot down to new pullback lows of 7.8119 shortly after the European open. Overnight swap rates have surged further still Friday (hitting 1.7% at typing), well ahead of the 0.3% prevailing rate mid-week and should continue to support a recovery in HIBOR fixes ahead. Today's 1m HIBOR fixed higher by 41bps, hitting 1.45% for the highest fix since mid-May. It's these factors that should work against the HKD carry trade (selling HKD, buying USD), evident in the further tightening of the HKD forward discount today: down 975 points from as high as 1270 this month.
- Focus in the coming week shifts to Jackson Hole and Powell's comments on Friday. With the September meeting still in flux - any conviction toward tipping the board toward a rate cut at the next FOMC will be carefully watched, but it's a hawkish outturn that could be more consequential for markets, as OIS prices a near 90% chance of easing on September 17th.
Want to read more?
Find more articles and bullets on these widgets:
Historical bullets
US INFLATION: MNI US Inflation Insight: Tariff Evidence Seeping In
We've just published our US Inflation Insight - Download Full Report Here
- June’s softer-than-expected core CPI reading (0.23% M/M vs 0.29% MNI median, 0.13% prior) came with a notable composition in light of mounting tariff pressures.
- Namely, core goods inflation was stronger than expected (0.20% M/M vs 0.19% MNI median, -0.04% prior), but that was outweighed by core services slightly on the light side (0.25% M/M vs 0.27% MNI median).
- Ex-vehicle goods inflation jumped in what is arguably the clearest sign yet that tariffs are beginning to seep through into CPI. Indeed there was a broader increase in core goods inflation for a second month, with multiple core goods areas that are seen sensitive to tariffs seeing acceleration including apparel, recreation commodities and household furnishings and supplies.
- Against this backdrop, Regional Fed banks’ estimates of sticky/median Y/Y CPI rates appear to have bottomed in the spring, at least for now, at levels above pre-pandemic averages.
- That said, the June Producer Price Index report was roundly softer than expected - and certainly than feared given the context of rising tariffs - despite some upward revisions to prior. While core goods prices did indeed advance, and there continued to be problematic readings in categories such as durable goods, the rise was consistent with the increases seen over the last 6 months rather than a sudden surge.
- In short, this round of data didn’t settle the question of whether tariff-related price increase would be sufficiently acute to warrant holding rates for an extended period. As noted in the July Beige Book, Fed business contacts’ comments suggested “consumer prices will start to rise more rapidly by late summer."
- Post-PPI estimates of the Fed’s preferred core PCE gauge centered on 0.29% M/M for June vs 0.31% after the CPI report, still an increase from the 0.25% very tentatively eyed ahead of both CPI and PPI releases.
- Through this week’s inflation round, market pricing for Fed easing ended largely steady (with almost 50bp of cuts through end-2025 and a first cut by October), though not before CPI saw cuts pared on the stronger details and then PPI restored some confidence in future easing.
- Overall though, the Fed is set to stay on the sidelines for the summer.

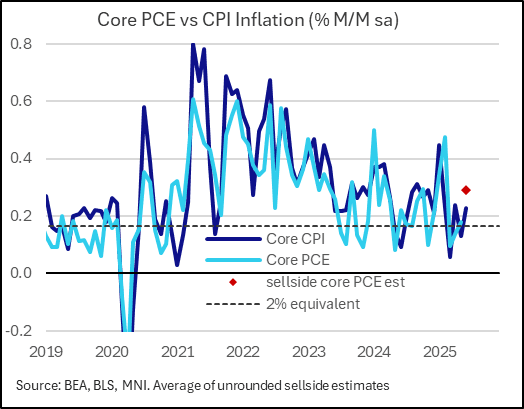
US INFLATION: Core PCE Consensus Dips To Just Under 0.3% After PPI Details
Analyst core PCE estimates have been tweaked a little lower after the PPI details, but perhaps by a little less than we expected.
- Core PCE inflation should be set for an acceleration from the 0.18% M/M currently reported for May, which could potentially be revised up 0.01bp or so. We have seen post-PPI estimates centering on 0.29% M/M for June vs 0.31% after Tuesday’s CPI report, still an increase from the 0.25% very tentatively eyed ahead of both CPI and PPI releases.
- Recall core CPI came in at 0.23% in June, after 0.08% in May, and all estimates we've seen show June PCE exceeding that.
- Goldman Sachs: 0.26% vs 0.29% post-CPI, pre-PPI
- Morgan Stanley: 0.27% vs 0.35% post-CPI, pre-PPI
- Nomura: 0.29% vs 0.35% post-CPI, pre-PPI
- Barclays: 0.30% vs 0.29% post-CPI, pre-PPI
- BofA: 0.31%
USDCAD TECHS: Trend Signals Remain Bearish
- RES 4: 1.3920 High May 21
- RES 3: 1.3862 High May 29
- RES 2: 1.3798 High Jun 23
- RES 1: 1.3749 50-day EMA
- PRICE: 1.3697 @ 17:10 BST Jul 16
- SUP 1: 1.3557 Low Jul 03
- SUP 2: 1.3540 Low Jun 16 and the bear trigger
- SUP 3: 1.3503 1.618 proj of the Feb 3 - 14 - Mar 4 price swing
- SUP 4: 1.3473 Low Oct 2 2024
USDCAD faded fast off intraday highs. The 50-day EMA was very briefly pierced, but sharp intraday volatility dragged the price lower into the close. This affirms the view that short-term gains appear corrective. As such, resistance at the 50-day EMA, at 1.3749 remains valid. A clear break of the EMA would signal scope for a stronger recovery and highlight a possible reversal. For bears, sights are on key support at 1.3540, the Jun 16 low. Clearance of this level would confirm a resumption of the downtrend and open 1.3503, a Fibonacci projection.