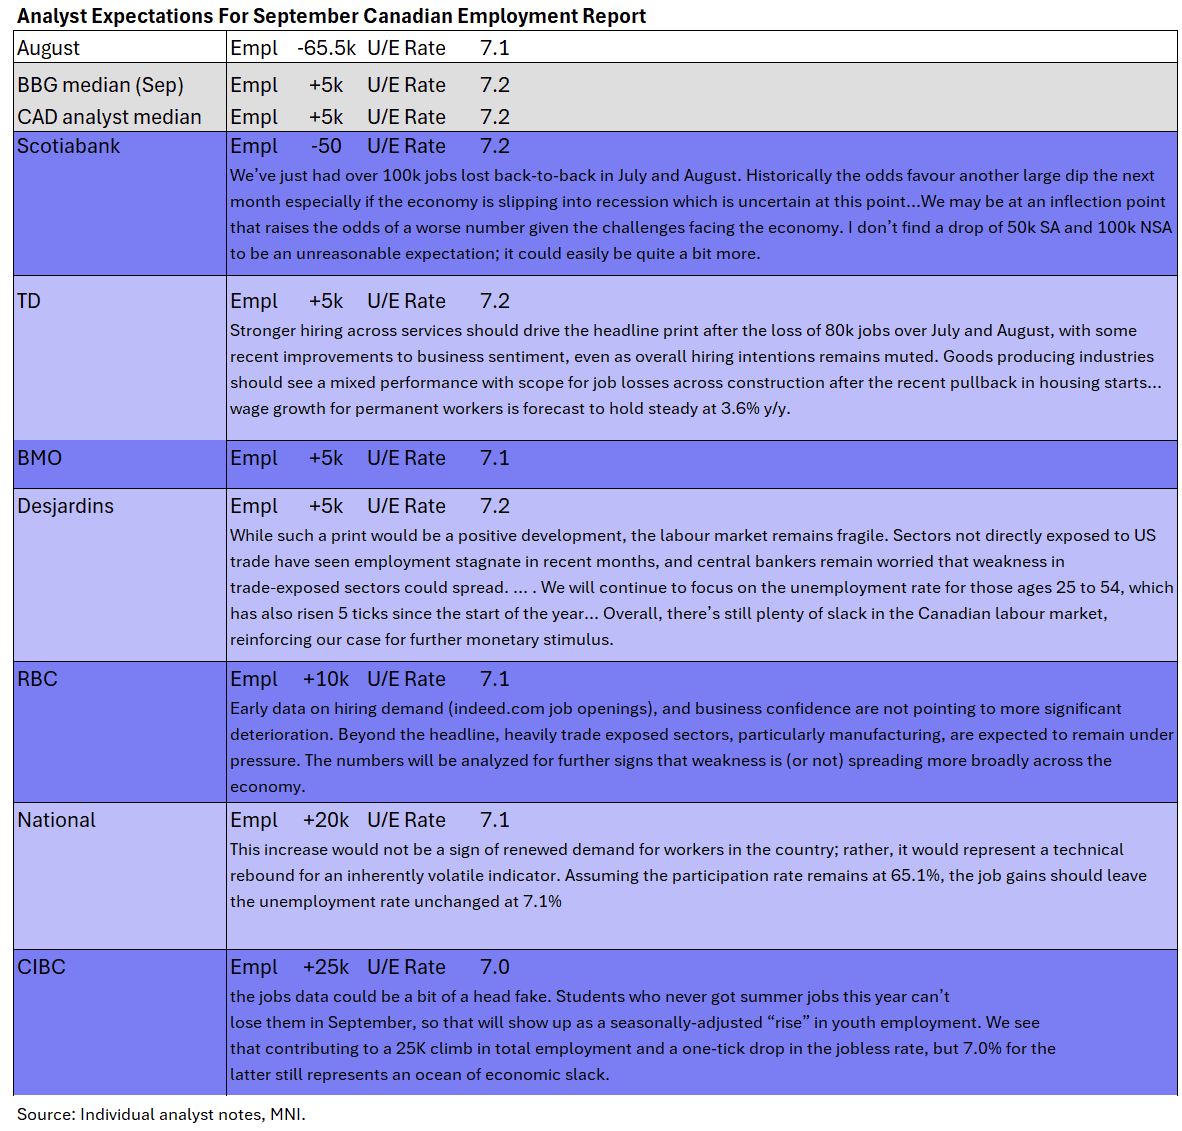
CANADA: September LFS Expectations Tilt To At Best Stabilization After Weakness
Reupping our preview from yesterday: September's Labour Force Survey (0830ET) is not expected to dissuade the Bank of Canada from cutting rates for a 2nd consecutive meeting in October, with the early analyst consensus eyeing only a small increase in employment in September (5k) with another uptick in the unemployment rate (0.1pp to 7.2%). Analyst views in the table below.
- Current BOC meeting-dated OIS implied cumulative rates: Oct -14.9bp, Dec -22.5bp, Jan -27.2bp, Mar -29.6bp
Want to read more?
Find more articles and bullets on these widgets:
Historical bullets
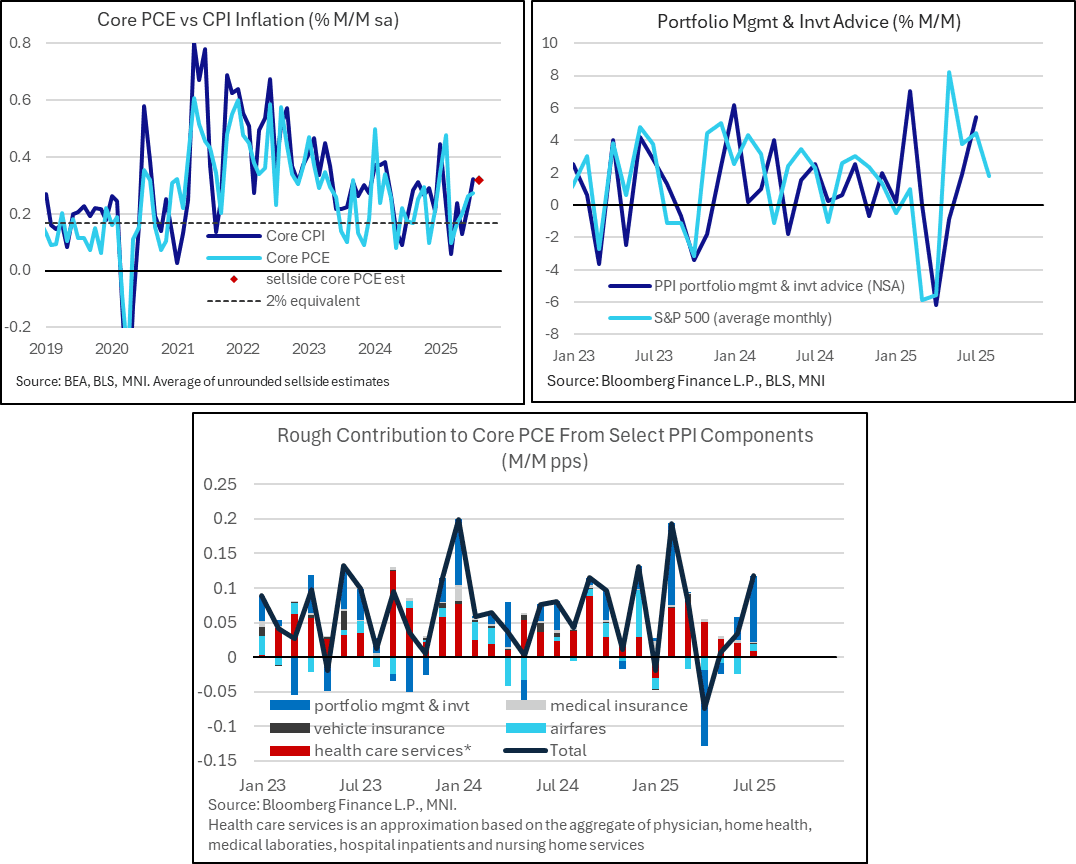
US OUTLOOK/OPINION: PCE Components To Watch Out For In PPI (3/3)
- As for some of the PPI-specific components that feed into PCE calculations, expect the usual focus on airfares, portfolio management, vehicle insurance and a raft of health services.
- The below categories are on a non-seasonally adjusted basis:
- Portfolio management and investment advice: it increased a strong 5.4% M/M in July as it reflected equity market strength with a slightly longer than usual. We wouldn’t be surprised to see another sizeable increase. Nomura look for a “decent” 2.2% increase.
- Domestic airfares: Seasonal norms suggest that this should decline further after the -2.15% M/M in July. Nomura: “Although PPI's domestic airline fares likely declined by 3.1% m-o-m, the expected decline was mostly due to a seasonal movement, which is likely to be largely offset by the BEA's seasonal adjustment when it is incorporated into core PCE inflation calculation”
- Health care services (for a crude proxy of categories that feed into PCE): Nomura estimate a “trend-like” pace of 0.1-0.2% M/M.
- As for where core PCE estimates currently stand, in the limited number of estimates we’ve seen, the readthrough for the month’s core PCE is seen as relatively minor in terms of directional divergence. Median core PCE estimates are for 0.31% M/M vs 0.27% prior and 0.32% for core CPI, with no analysts seeing core PCE printing above core CPI.
- As it stands, the M/M core PCE estimate would be the highest since February.
US OUTLOOK/OPINION: Analyst Views On Main PPI Metrics (2/3)
Three analyst views for the main PPI metrics ranging from above, close to, and below consensus for August.
- NatWest: PPI seen rising 0.5% M/M in August after 0.9% M/M in July.
- “Food and energy costs are expected to have firmed again in August, while trade services (which measure changes in retailer and wholesaler margins) could have increased more modestly (after a 2.0% jump in July).”
“Excluding the volatile categories of food, energy and trade services we expect the core PPI increased by 0.3%, following a 0.6% spike in July. Strength in transportation and financial services costs accounted for almost 50% of the 0.6% gain in core prices in July. We expect a more modest but still positive contribution from those two measures in August”
- JPM: PPI final demand seen at 0.2% M/M in August, “notably cooler than the surprise” 0.9% M/M in July. It reflects “in part notably weaker contributions from food and energy”, with PPI energy -0.8% M/M after 0.9% M/M in both June and July and flat PPI food prices after two stronger gains.
- It would see Y/Y PPI inflation ease modestly to 3.2% Y/Y after jumping from 2.4% to 3.3% Y/Y in July.
- PPI ex food & energy seen rising 0.3% M/M and 3.5% Y/Y, the latter down from 3.7% Y/Y in July.
- PPI core goods seen at 0.4% M/M for a second month, “continuing on the recent gradual acceleration in core goods PPI prices that likely has a growing contribution from tariffs”. It could see additional upside pressure as “additional tariffs come into place and firms move toward passing on a larger share of those cost pressures”.
- “Core services prices shot up strongly in the July report on a big increase in trade services […]; this category is both volatile and prone to revisions, so we do not forecast a similar dynamic for August. That said, there certainly is some risk that another such contribution could be recorded.”
- UBS: PPI final demand seen flat in August. PPI food seen at -0.7% M/M “while energy costs should play a marginal role in the headline measure this time.”
- “Core goods are likely to see a moderate increase of 0.3%. Trade services, having surged 2.0% in July—the sharpest monthly rise since March 2022—are forecasted to retreat.”
- “This component, which reflects margins for wholesalers and retailers, remains volatile, especially as recent tariff changes could force businesses to absorb added costs into margins.”
- PPI ex food & energy seen rising “just” 0.1% M/M for a “notable deceleration”.
- “Core PPI, which strips out food, energy, and trade services, is forecasted to grow by a steady 0.2% M/M”.
US OUTLOOK/OPINION: PPI Seen Slowing To Still-Solid Pace; Watch Revisions (1/3)
- PPI inflation for August is released today at 0830ET, in only the second month of the year where it comes ahead of CPI.
- It’s going to be watched particularly closely after last month’s surprising surge to a forty-month high for monthly inflation across all three major categories. Consensus looks for some moderation to a still solid 0.3% M/M whilst the data are also revision-prone which could take some of the sting out of July’s rise.
- Headline PPI inflation is seen at 0.3% M/M in Aug after 0.94% M/M.
- One core PPI measure (ex food & energy) is also seen at 0.3% M/M after 0.92%.
- Our preferred measure of core PPI (ex food, energy & trade services) is seen at 0.3% M/M after 0.61% M/M. For recent context, this follows an average 0.3% M/M through Q1 before a soft patch with an average 0.0% M/M in Q2 prior to that July surge.
- We prefer this narrower measure of core because it excludes the volatile trade services category. The latter captures imputed changes in retailer and wholesaler margins and jumped 2.0% M/M in Jul after -0.3% in Jun, 1.5% in May and -0.3% in Apr. One particularly strong area here was margins for machinery & equipment wholesaling at 3.8% M/M.
- We wouldn't be surprised by large revisions in these very volatile categories. April's PPI report for example showed the biggest decline in final demand services in index history (to 2009), at -0.7%, due in large part to a 1.6% drop in final demand trade services within which was a 6.1% plunge in "machinery and vehicle wholesaling" prices. But by the next month's report these were revised respectively to -0.4%/-0.5%/-0.9% (with revs to prior months as well).
- All of these core PPI figures capture other noisy imputed services such as “portfolio management & investment advice”, although we still touch directly on the latter when it comes to core PCE implications (more on this to follow).
- Note that differing levels of Bloomberg survey responses, with headline consensus based off 52 estimates and ex food & energy based off 44 but ex food, energy & trade from just 6 estimates.
- When it comes to the narrower core PPI expectations, five analysts look for 0.3% M/M (including Citi, GS and Wrightson ICAP) and one for 0.2% M/M (UBS). That’s not a uniform view more broadly, however, with RBC for instance eyeing “another hefty” 0.62% M/M.