POWER: German Power Price to Average €75/MWh in 2026-28
BNEF forecasts German power prices to average €75/MWh over 2026-2028, down from €85/MWh this year amid easing gas prices, it said.
- Higher gas prices have supported Germany power markets this year to rise to €85/MWh, from €80/MWh in 2024.
- Current forward prices are 5% higher than BNEF’s 2026-2028 forecast with markets placing a premium on German power prices between July and March.
- From 2029, the German power price is forecast to fall by 5.4%/yr to €47/MWh in 2035. The decline is largely driven by more renewable capacity replacing gas, coal and lignite in the supply stack.
- Germany Power Cal 26 up 0.8% at 87.75 EUR/MWh
- Germany Power Cal 27 up 0.4% at 83.74 EUR/MWh
- Germany Power Cal 28 up 0.7% at 77.35 EUR/MWh
Want to read more?
Find more articles and bullets on these widgets:
Historical bullets
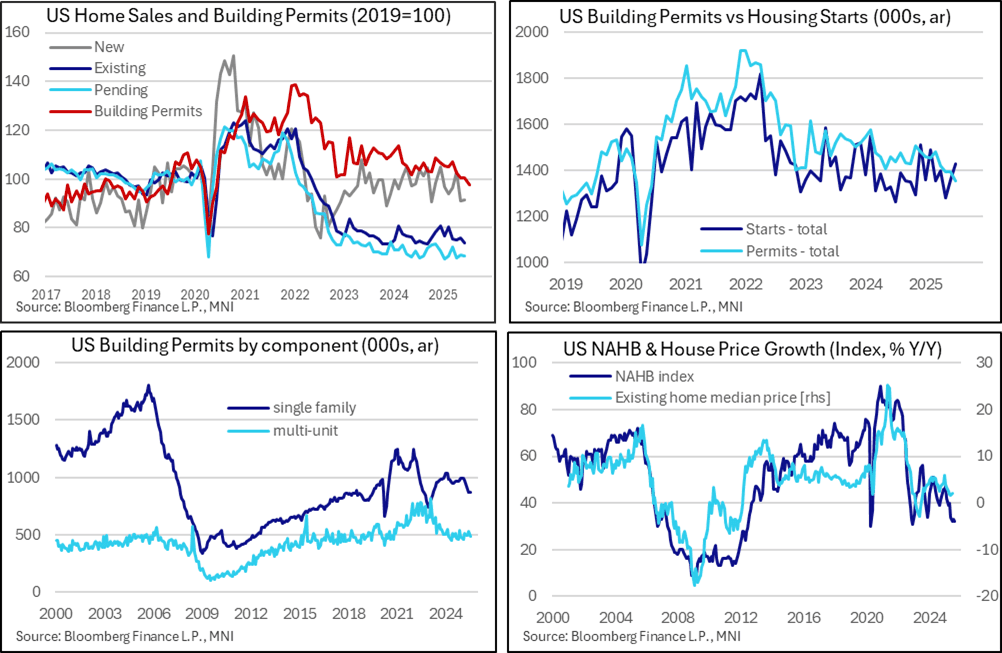
US DATA: Building Permits Downtrend Continues
Housing starts and building permits data for July offered firmly conflicting signs of housing activity, but with the less weather-sensitive permits series pointing to a clearer downtrend that chimes more closely with dour NAHB homebuilder sentiment.
- Housing starts were far stronger than expected in July at 1428k (saar, cons 1297k) after an upward revised 1358k (initial 1321k) in June.
- It left starts rising 5.2% M/M (cons -1.8%) after a stronger than first thought 5.9% (initial 4.6%) as they bounced after a -8.3% M/M decline in May (also revised from -9.7%).
- This series continues to be heavily driven by multi-units, which increased 10% M/M after 34% in June and -26% in May. Single family starts meanwhile increased 2.8% M/M after -3.8% and 0.1%.
- However, building permits are less volatile, not least because they are more resilient to weather changes, and these disappointed as they continued to show a clear downtrend, slipping to 1354k (saar, cons 1386k) in preliminary July data after 1393k in June.
- That left permits -2.8% M/M after briefly pausing in June following two heavier declines in April and May. Permits have only increased in one of the past eight months and are currently at their lowest since Jun 2020
- Within this, single family permits at least stopped falling after some heavy declines, rising 0.5% M/M after a cumulative 13% from Feb to June. The ever-volatile multi-units drove the latest weakness with -8.2% M/M after a 6.5% increase that had left them at their highest since Nov 2024.
- For a better sense of trends, housing starts are up 12.9% Y/Y (and 111% of 2019 levels) yet building permits paint a much weaker picture at -5.7% Y/Y (98% of 2019 levels).
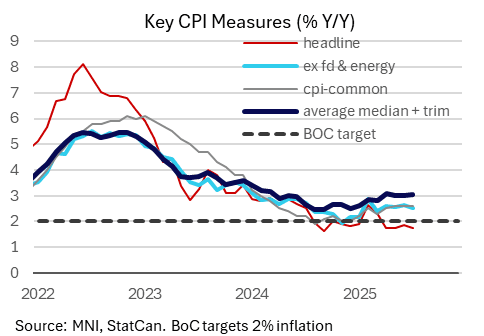
CANADA DATA: July CPI Aggregates Come In On Soft Side
The major July Canadian CPI aggregates came in on the soft side, with some signs that underlying inflation momentum has peaked.
- All-items CPI rose 1.73% Y/Y unrounded (1.86% prior, 1.8% expected by MNI median), and 0.12% M/M (0.18% prior, 0.4% expected). It's the 4th consecutive month headline has printed below 2.0% Y/Y, while ex-food/energy Y/Y dipped to a 5-month low 2.50% (2.64% prior).
- The key trim/median readings came out roughly in line too, with trim at 3.00% Y/Y and median 3.10% for an average 3.05%. Technically this marked the highest since April because the June figures were downwardly revised (Median to 3.00%, making the average 3.00% instead of 3.05% - seasonally-adjusted figures like this can be revised on a month-to-month basis by StatCan).
- The common measure was 2.6% Y/Y for a 3rd consecutive months (no consensus).
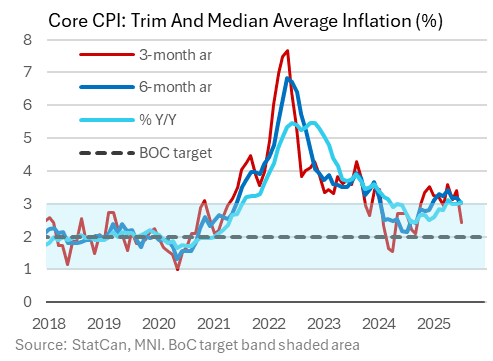
- On a seasonally-adjusted basis, M/M % CPI dipped to 0.12% after 0.18% prior; ex-food/energy to 0.06% after 0.19% (for a 4-month low). SA core was also revised down for June, from 0.26%, leaving the trend rates of core diminishing: 3mma annualized at 2.1% (lowest since November 2024), with 6mma at 2.6% (lowest since January).
- Excluding the the most volatile items and indirect taxes, M/M fell to a 4-month low 0.06% M/M after 0.32% in June, a 4-month low and taming longer-term run rates (6mma at 2.5% after 3.1% for a 7-month low).
- And when we look at trim/median average inflation SA annualized run rates, we see a slowdown: 2.4% 3mma ann rate (3.4% prior, and lowest in 10 months) and 3.0% on 6-month (3.2% prior, lowest in 7 months). So while the key BOC Y/Y measures remain elevated, there is some sign that upside momentum has peaked.
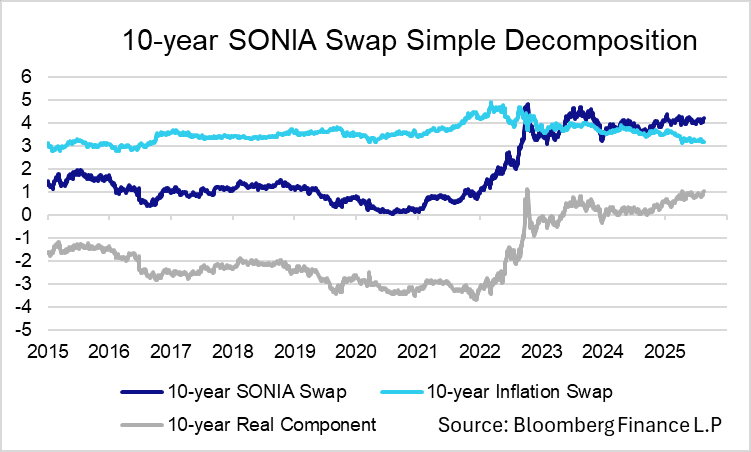
SONIA: [Correct] SONIA: Real Component of 10-year SONIA Swap Back Above 100bps
Corrects 0853BST Gilt Bullet
The real component of the 10-year SONIA swap moved above 100bps for the first time since April 9 yesterday, currently at ~102.5bps. Prior to April 2025, this rate was last above 100bps in October 2022 (i.e. the aftermath of the Truss mini budget crisis).
- With the UK growth outlook still relatively subdued, this is indicative of a rise in term premium - a theme that is present across global core FI curves.
- The 10-year GBP ZC inflation swap has gradually drifted lower since April 2024, last at 3.16%.
- Meanwhile, nominal 10-year SONIA swap rates are just shy of 4.20%, rising alongside Gilt yields in recent sessions to the highest since late May.
- Note: Contains correct chart for breakevens, incorporating swaps