USDCAD TECHS: Fresh Cycle High
- RES 4: 1.4111 High Apr 10
- RES 3: 1.4045 3.0% Upper Bollinger Band
- RES 2: 1.4019 38.2% retracement of the Feb 3 - Jun 16 bear leg
- RES 1: 1.3989 200-dma
- PRICE: 1.3953 @ 16:02 BST Oct 3
- SUP 1: 1.3897/3825 Low Sep 30 / 50-day EMA
- SUP 2: 1.3727 Low Aug 29 and a bear trigger
- SUP 3: 1.3689 Low Jul 28
- SUP 4: 1.3637 Low Jul 25
A bull cycle in USDCAD remains intact and yesterday’s break above the late September’s high, firms the bullish theme. This move higher also maintains the bullish price sequence of higher highs and higher lows. Note too that moving average studies are in a bull-mode position, highlighting a dominant uptrend. Sights are on 1.4019, a Fibonacci retracement point. On the downside, first key support lies at 1.3825, the 50-day EMA.
Want to read more?
Find more articles and bullets on these widgets:
Historical bullets
USDCAD TECHS: Recovers From Its Recent Lows
- RES 4: 1.4019 38.2% retracement of the Feb 3 - Jun 16 bear leg
- RES 3: 1.3925 High Aug 22 and the bull trigger
- RES 2: 1.3868 High Aug 26
- RES 1: 1.3815 High Sep 02
- PRICE: 1.3797 @ 16:47 BST Sep 3
- SUP 1: 1.3722 Low Aug 7 and a pivot support
- SUP 2: 1.3709 61.8% retracement of the Jul 23 - Aug 22 bull cycle
- SUP 3: 1.3658 76.4% retracement of the Jul 23 - Aug 22 bull cycle
- SUP 4: 1.3637 Low Jul 25
The bull cycle in USDCAD that started mid-June remains in play. However, the latest corrective pullback has resulted in a breach through support at the 50-day EMA, at 1.3775. A clear break of this handle signals scope for a deeper retracement and exposes 1.3722, the Aug 7 low. Near term, the recovery from the Aug 29 low also highlights a potential early reversal signal. A continuation higher would open the bull trigger at 1.3925, the Aug 22 high.
US OUTLOOK/OPINION: U/E Rate In Increasing Focus, FOMC Eyeing Trend Rise [2/2]
Cleveland Fed’s Hammack (’26 voter) is of a similar view to us, although actually puts even more weight on the unemployment rate. Speaking last month:
- "With the changes that have happened in immigration policy, it's not clear that that headline [payrolls] growth number is going to be as informative as things like the unemployment rate, the vacancies to unemployed ratio, other things that we're looking at on the employment side of the mandate, and that's because we've seen a massive shift.
- So yes labor demand may be coming down but labor supply has come down pretty dramatically as well. And so our goal of maintaining employment around maximum needs to look at both sides of that, and it could be that even though we're seeing much slower headline job growth numbers, it could be that the labor market is still in balance and so we'll need to look at the closely."
That’s a similar message to Fed Chair Powell from his Jackson Hole address on Aug 22, although he cast it in a more dovish light considering rising downside risks to employment and the potential for a quick deterioration:
- “The July employment report released earlier this month showed that payroll job growth slowed to an average pace of only 35,000 per month over the past three months, down from 168,000 per month during 2024 (figure 2). This slowdown is much larger than assessed just a month ago, as the earlier figures for May and June were revised down substantially. But it does not appear that the slowdown in job growth has opened up a large margin of slack in the labor market—an outcome we want to avoid.
- The unemployment rate, while edging up in July, stands at a historically low level of 4.2 percent and has been broadly stable over the past year. Other indicators of labor market conditions are also little changed or have softened only modestly, including quits, layoffs, the ratio of vacancies to unemployment, and nominal wage growth.
- Labor supply has softened in line with demand, sharply lowering the "breakeven" rate of job creation needed to hold the unemployment rate constant. Indeed, labor force growth has slowed considerably this year with the sharp falloff in immigration, and the labor force participation rate has edged down in recent months.
- Overall, while the labor market appears to be in balance, it is a curious kind of balance that results from a marked slowing in both the supply of and demand for workers. This unusual situation suggests that downside risks to employment are rising. And if those risks materialize, they can do so quickly in the form of sharply higher layoffs and rising unemployment.”
US OUTLOOK/OPINION: U/E Rate In Increasing Focus, FOMC Eyeing Trend Rise [1/2]
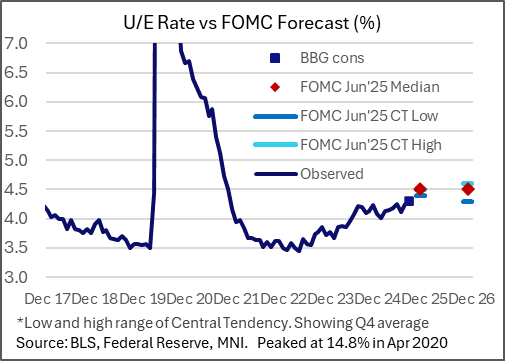
- We have been writing for some time now that the unemployment rate should be watched as closely as the payrolls figures to give a better sense of labor market balance. To this end, the unemployment rate is seen at 4.3% in August after rising to 4.25% in July. That was technically a cycle high but with the rate tracking between 4-4.25% ever since a high of 4.22% back in July last year.
- Whilst now outdated, the median FOMC forecast from the June SEP had the unemployment rate increasing to an average 4.5% in 4Q25 as part of its profile with 50bp of cuts to year end.
- A reminder that this data is of course taken from the separate household survey. Highlighting just how different these can be month-to-month, Scotia are the most pessimistic of primary dealer analysts for payrolls estimates (0k) yet the most hawkish for the unemployment (4.1%).
- As for latest moves in the household survey, unemployment increased 221k in July after -222k in June whilst employment fell 260k after a tepid 93k increase in June. It netted out at a -38k decline in the labor force, unusually a third consecutive monthly decline after -130k in June and a heavy -625k in May after jumping 544k in April. That could see prospects for a bounce back in employment in the typically volatile survey.