AUSSIE BONDS: Forthcoming ACGB Transactions
Next week, ACGB supply will be in line with the recent average weekly issuance of $2000mn. * The AO...
Want to read more?
Find more articles and bullets on these widgets:
Historical bullets
USD: BBDXY - Trades Heavy Below 1190 Even With Oil Surging Higher
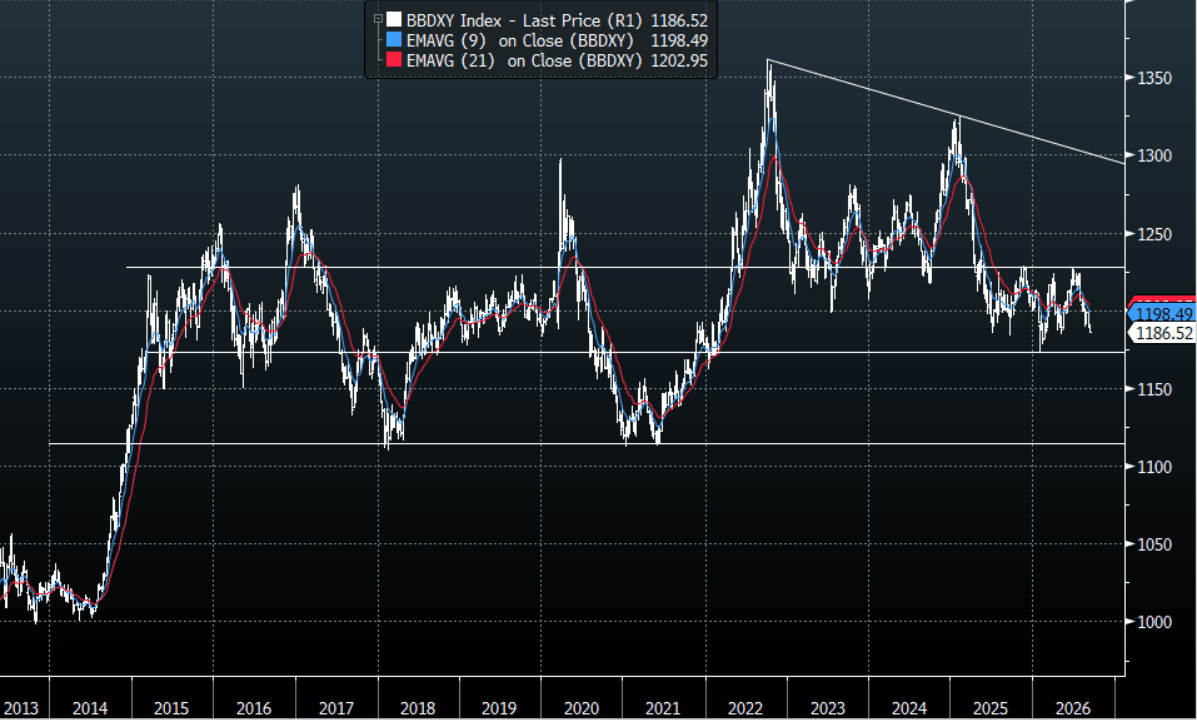
The BBDXY range overnight was 1186.27-1189.26, Asia is currently trading around 1186, -0.10%. The US Dollar continues to trade very heavy and the price action is looking deeply concerning. A dovish Waller last week has tipped the broader US Dollar complex over the edge and made the upcoming inflation data this week pivotal. USD/JPY longs being caught wrong-footed as stops are triggered in very thin liquidity is just adding to the broader US Dollars malaise. The Dollar's inability to get even the hint of a bid as Oil surges back toward $100 also looks ominous. On the day, I will be watching to see if this move can build into something more substantial. Though we might have to wait for the inflation data later in the week before the market truly starts adding to positions. A low print and the USD bears could return en masse to challenge the year's lows toward 1170.
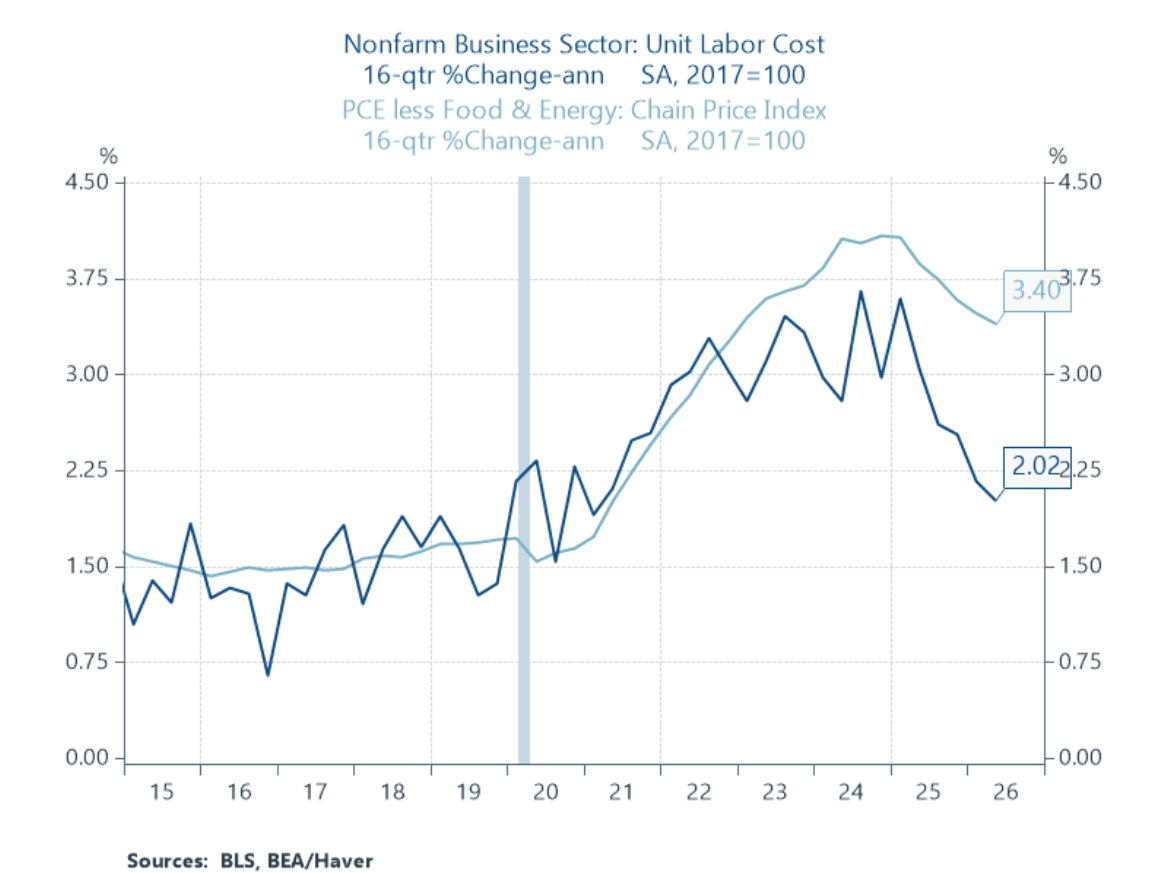
- RenMac on X: “Waller: "in contrast to the period of high inflation after the pandemic, wage growth, once one accounts for productivity growth, is broadly consistent with an expectation that inflation is continuing to come down to 2 percent." This is a notable comment from Governor Waller because for about four years now, unit labor costs have been broadly consistent with two percent inflation even though measured inflation has not been consistent with two percent inflation.”
- “Fed Chairman Kevin Warsh’s hawkish Jackson Hole pivot and stronger payrolls have pushed the front end toward renewed tightening risk, with markets assigning roughly a 60% probability to a September hike and pricing about 62 basis points of cumulative tightening through 2027.” - BBG
- Steve Hanke on X: “Commodity market guru Jeff Currie on gold vs. fiat: "I want to own gold over the dollar and the pound sterling. Hard assets, which are independent of central banks, treasuries, and other policymakers, are where the value is going to be generated."
- The BBDXY Average True Range for the last 10 Trading days: 3.75 Points
Fig 1: BBDXY Weekly Chart
Source: MNI - Market News/Bloomberg Finance L.P
AUDNZD: Breaks Above Years highs As Market Rushes To Reinstate Longs
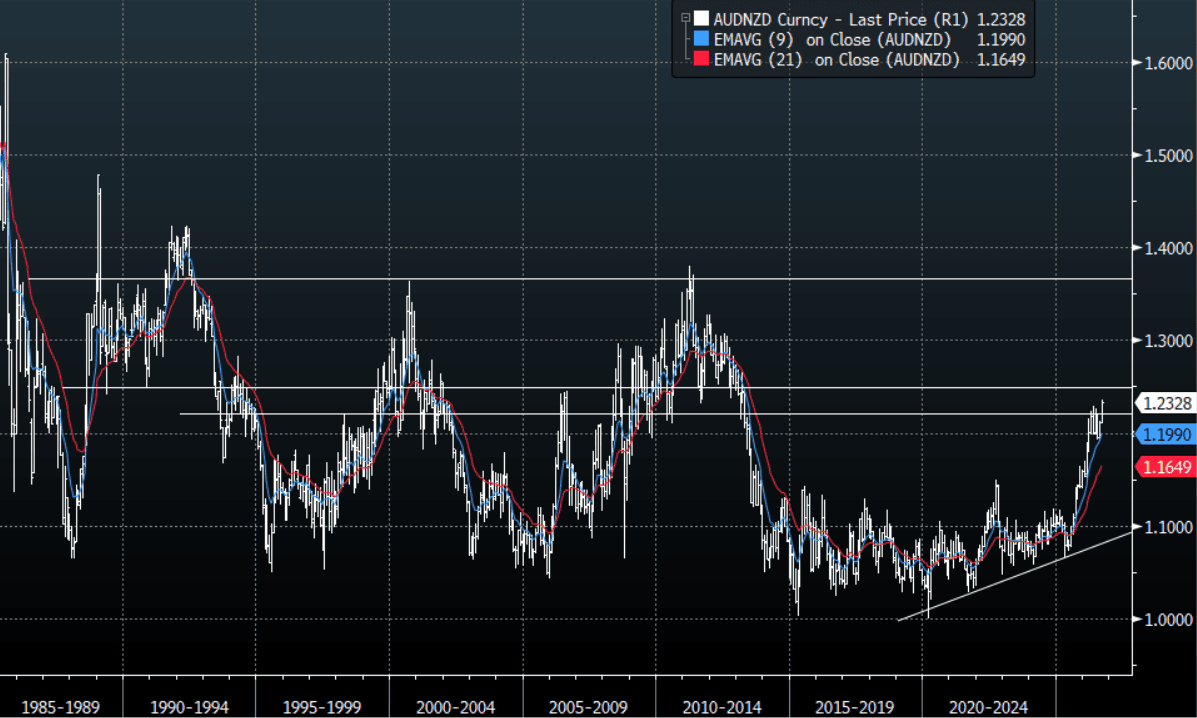
The AUD/NZD overnight range was 1.2306-1.2353, the Cross is trading in Asia around 1.2330. The Cross has surged off its lows thanks to the higher Aussie inflation data and a dovish RBNZ meeting. A hike by the RBA in September is back on the table and as a result has seen this pair surge toward and break above the year's highs. This break above 1.2300 would have seen another wave of buying as longs are reinstated and added to. The Bulls technically still maintain firm control while the pair continues to hold above the 1.1800-1.1900 support and this break is an attempt to reassert its trend higher. I still have some decent resistance in this 1.2300-1.2600 area and remain wary of initiating a long up here but those that are already long should continue to ride the trend. On the day the first support comes in around 1.2270-1.2300 and I suspect the market will be looking for this break above 1.2300 to gain momentum and extend.
- Bloomberg - “Goldman Sach economists say that after Reserve Bank of Australia Deputy Governor Andrew Hauser and Chief Economist Sarah Hunter delivered remarks which they viewed as “incrementally hawkish”, they have brought forward their interest rate hike call to September from November forecast earlier.”
- The AUD/NZD Average True Range(ATR) for the last 10 Trading days: 63 Points
Fig 1: AUD/NZD spot Monthly Chart
Source: MNI - Market News/Bloomberg Finance L.P
US STOCKS: S&P - Drifts Lower As Oil Extends Higher On Middle-East Flare Up
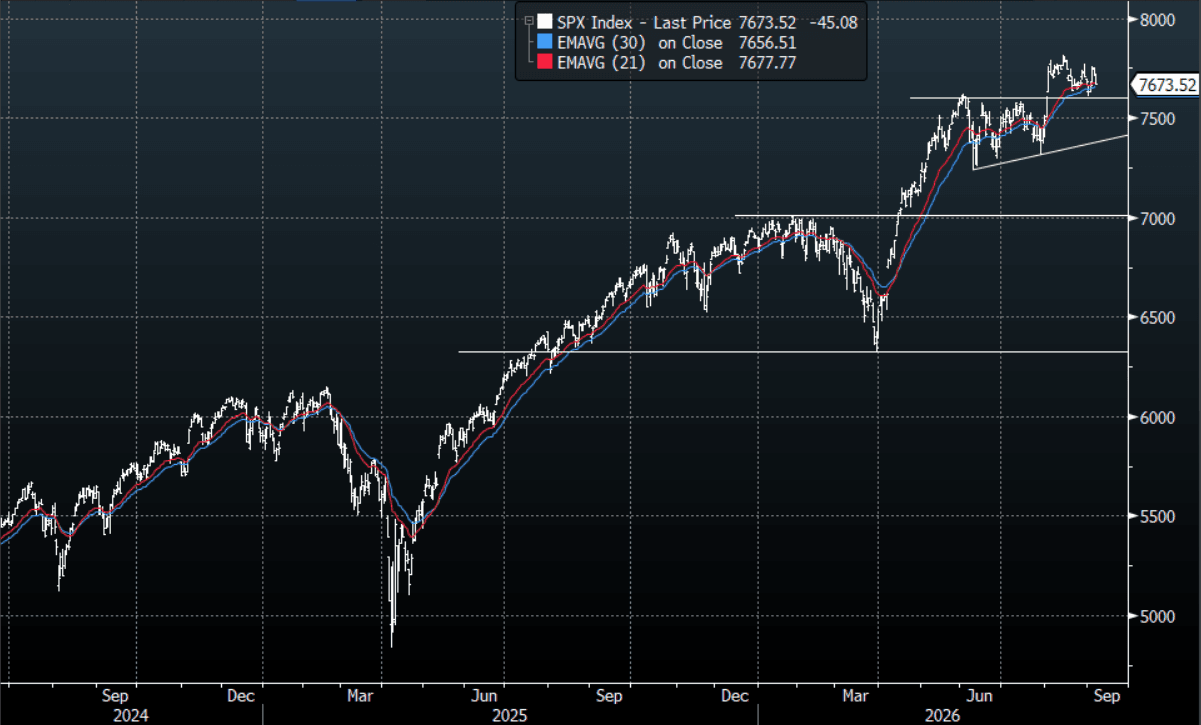
The S&P(ESU6) range overnight was 7672.25 - 7718.25, SPX was closed yesterday, Asia is currently trading around 7677. A strong NFP print has seen Equities top out and drift lower but after Waller's dovish tilt last week the CPI coming up will be pivotal as the market wrestles with whether Warsh will be able to hike rates or not. Oil continues to press higher as the flare-up in the Middle-East is at risk of expanding. Risk seems to be shrugging off the move due to headline fatigue for now but if or when it starts showing up in the data it could prove pivotal. While the S&P(SPX) holds above 7250-7300 the bulls remain in control and they are now attempting to build a base from which to reassert its uptrend. On the day, the price looks like 7600-7800 should capture it for now as we look toward the August CPI for any clues it can provide toward a potential US hike. The more a potential hike gets walked back the more the Stock market should like it.
- RenMac on X: “Waller: "in contrast to the period of high inflation after the pandemic, wage growth, once one accounts for productivity growth, is broadly consistent with an expectation that inflation is continuing to come down to 2 percent." This is a notable comment from Governor Waller because for about four years now, unit labor costs have been broadly consistent with two percent inflation even though measured inflation has not been consistent with two percent inflation.” See Fig.1 below.
- Jeffrey Currie on X: “We’re in a critical situation right now - there’s no easy fix to a lack of refinery capacity, a lack of strategic reserves and products, and now-depleted crude reserves. The market is obsessed with crude oil - but everyone reading this right now, as well as the rest of the world, mostly has exposure to the refined product: gasoline, diesel, jet fuel. That will hit the headline CPI index very soon.” https://x.com/CommodMkt/status/2097233803676733522?s=20
- Danny Citrinowicz on X: “The current status quo is therefore inherently unstable. Iran will not simply accept an indefinite maritime blockade, nor will it allow Washington to impose mounting economic costs without imposing costs of its own. The key question for Washington is no longer whether Iran will respond to additional pressure, but how far both sides are prepared to climb an escalation ladder that neither appears capable of controlling.” https://x.com/citrinowicz/status/2097447835364925797?s=20
- The S&P 500 Index Average True Range(ATR) for the last 10 Trading days: 58 Points
Fig 1: NF Unit Labor Cost Vs PCE less Food & Energy
Source: MNI - Market News/@RenMacLLC
Fig 2: S&P 500 Index Daily Chart
Source: MNI - Market News/Bloomberg Finance L.P


