GBPUSD TECHS: Bearish Threat
- RES 4: 1.3681 High Jul 4
- RES 3: 1.3636 76.4% retracement of the Jul 1 - Aug1 downleg
- RES 2: 1.3550/3595 High Sep 1 / High Aug 14
- RES 1: 1.3742 20-day EMA
- PRICE: 1.3451 @ 16:36 BST Sep 3
- SUP 1: 1.3322 Low Sep 3
- SUP 2: 1.3315 61.8% retracement of the Aug 1 - 14 bull leg
- SUP 3: 1.3249 76.4% retracement of the Aug 1 - 14 bull leg
- SUP 4: 1.3142 Low Aug 1 and a key support
Tuesday’s sell-off in GBPUSD undermines the recent bull theme. The pair has traded through a key support at 1.3391, the Aug 22 low. The clear break of this level signals scope for a deeper retracement and exposes 1.3315 next, a Fibonacci retracement. Clearance of this level would strengthen a bearish threat. For bulls, a breach of 1.3595, the Aug 14 high, is required to reinstate a bull theme. Initial resistance is at 1.3742, the 20-day EMA.
Want to read more?
Find more articles and bullets on these widgets:
Historical bullets
GBPUSD TECHS: Maintains A Softer Tone
- RES 4: 1.3681 High Jul 4
- RES 3: 1.3620 High Jul 10
- RES 2: 1.3448/1.3589 50-day EMA / High Jul 24
- RES 1: 1.3365 Low Jul 16
- PRICE: 1.3284 @ 17:16 BST Aug 4
- SUP 1: 1.3144 38.2% retracement of the Jan 13 - Jul 1 bull cycle
- SUP 2: 1.3041 Low Apr 14
- SUP 3: 1.3000 Round number support
- SUP 4: 1.2945 50.0% retracement of the Jan 13 - Jul 1 bull cycle
A bearish theme in GBPUSD remains intact for now - despite Friday’s rally. Last week’s sell-off resulted in a breach of the bear trigger at 1.3365, the Jul 16 low. The break confirms a resumption of the downleg that started Jul 1 and highlights a clear breach of the trendline drawn from the Jan 13 low. Sights are on 1.3144, a Fibonacci retracement, and 1.3041, the Apr 14 low. Firm resistance is 1.3448, the 50-day EMA. A break of this average is required to signal a reversal.
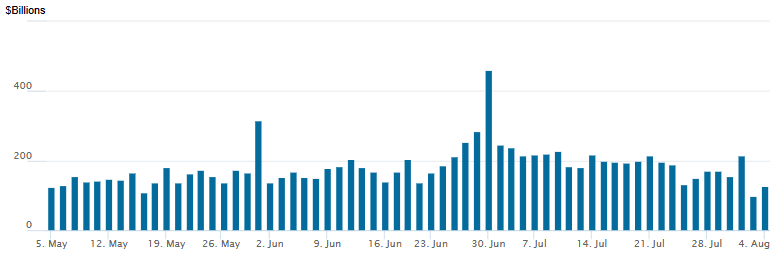
US: FED Reverse Repo Operation
RRP usage rebounds to $125.730B this afternoon from $97.426B Friday (lowest levels since April 25), total number of counterparties at 26. Lowest usage of the year at $54.772B on Wednesday, April 16 -- in turn the lowest level since April 2021 - compares to July 1: $460.731B highest usage since December 31.
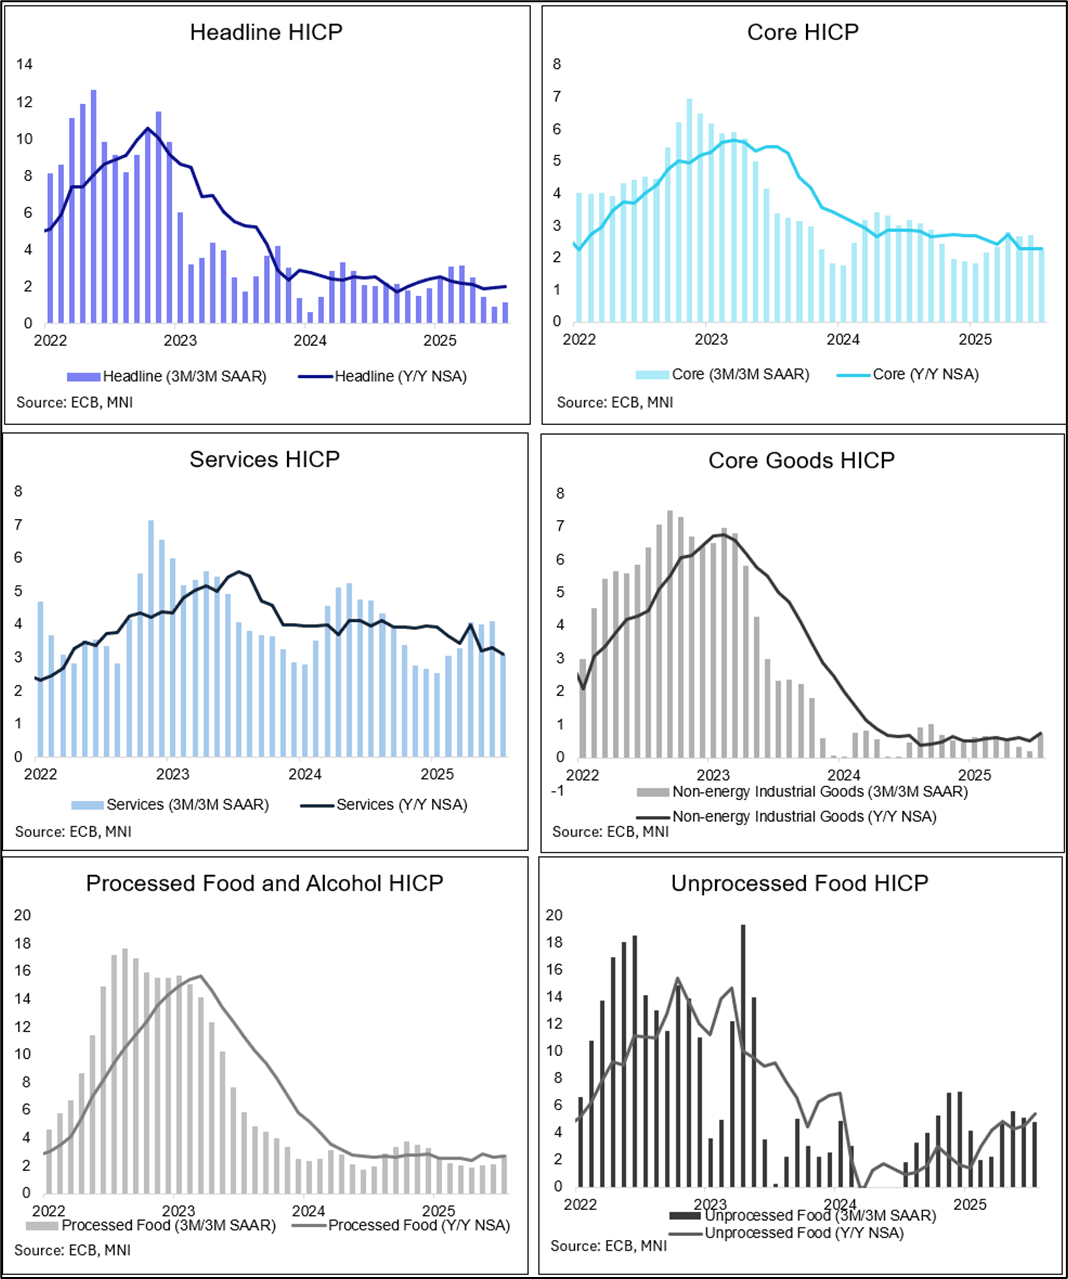
EUROPEAN INFLATION: July SA Data Questions Narrative Around Residual Seasonality
The ECB’s seasonally adjusted data on the July inflation round (released Friday) saw Eurozone core inflation at 0.24% M/M in July after 0.30% in June. Services prices rose 0.17% M/M (vs 0.45% prior), while non-energy industrial goods prices rose 0.36% M/M (vs 0.04% prior).
- This brought down much-eyed services ‘momentum’ (3m/3m SAAR) to 3.07%, materially below the 4% level around where it stood for the last three months. Crucially, July’s drop comes in the summer period, which during the last two years was characterized by well elevated readings – prompting some questions around residual seasonality in the ECB seasonally adjusted data. This year’s July developments pose a counterargument to such a narrative, pointing in favour of ongoing disinflation even if at 3.1% it’s still only back in line with the 3.1% Y/Y.
- Momentum in non-energy goods inflation meanwhile ticked up in July to 0.71% (0.21% prior). This was the highest reading since last September, with the increase since June potentially underpinned by changing or less material seasonal summer clothing sales, national-level data suggests.