ITALY DATA: August Industrial Production Weaker With Plentitude Of Moving Parts
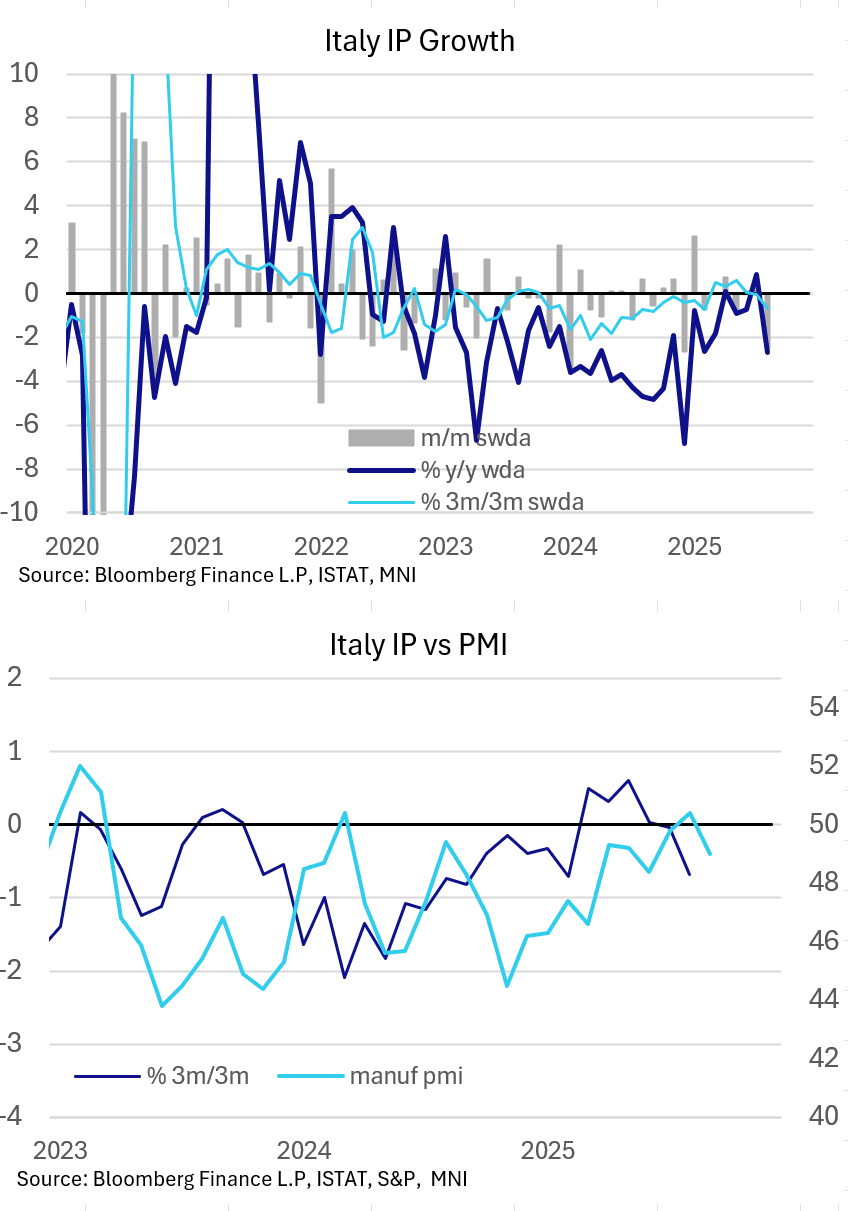
Italian industrial production was weaker than expected in August, falling 2.4% M/M (-0.4% consensus, 0.4% prior). The release caps off a weak-leaning month in IP for the 'big 4' Eurozone countries, with Germany notably underperforming and France also seeing a negative sequential growth rate; only Spain had another month of strong gains in its industrial sector this time.
- The sectoral split raises some questions around the Italy headline M/M figure, with both manufacturing (-1.9% M/M vs 1.4% prior) and energy (-0.6% M/M vs -7.6% prior) printing better than the overall reading. Seasonal factors may be an influence here: The working-day (but not seasonally) adjusted Italian IP index read a mere 61.3 in August, vs 103.6 in July, representing a decline of 2.7% Y/Y (vs 0.6% consensus, 0.9% prior) and highlighting the impact of summer holidays on production cycles in the country.
- Within manufacturing, there were many moving parts: Food and beverage production stand out negatively, seeing a 3.2% decline on a sequential comparison but that comes after a strong 3.2% gain in July. Textiles meanwhile were notably strong at +3.7% (0.8% prior). However, within the main categories, there were little lasting directional trends observable over the last couple of months.
- Note that in September, the Italy manufacturing PMI surprised to the downside: "Contributing to the contraction in operating conditions was a renewed drop in new orders. September data indicated a solid decrease in new sales, and one that was the fastest since June. The reduction in new business was attributed by firms to hesitancy among customers amid economic uncertainty."
Want to read more?
Find more articles and bullets on these widgets:
Historical bullets
FED FUNDS FUTURES: BLOCK: Nov'25 FF Buy
- +12,000 FFX5 from 96.14 to -.145 at 0916:10ET
- The Nov'25 contract trades 96.145 last (+0.015)
PIPELINE: Corporate Bond Update: $3B IDA 7Y SOFR Launched
- Date $MM Issuer (Priced *, Launch #)
- 09/09 $3B #IDA (International Development Assn) 7Y SOFR+55
- 09/10 $3B #KFW 3Y SOFR+30
- 09/10 $1B Federal Home Loan 2Y +4
- 09/10 $900M K Hovnian Ent 5.5NC2.5, 8NC3
- 09/09 $Benchmark Komatsu Finance AM 5Y +95a
- 09/09 $Benchmark Saudi Aramco 5Y Sukuk +105a, 10Y +115a (books over $16.5B)
US DATA: Volatile Trade Services Cool PPI More Than Expected (1/2)
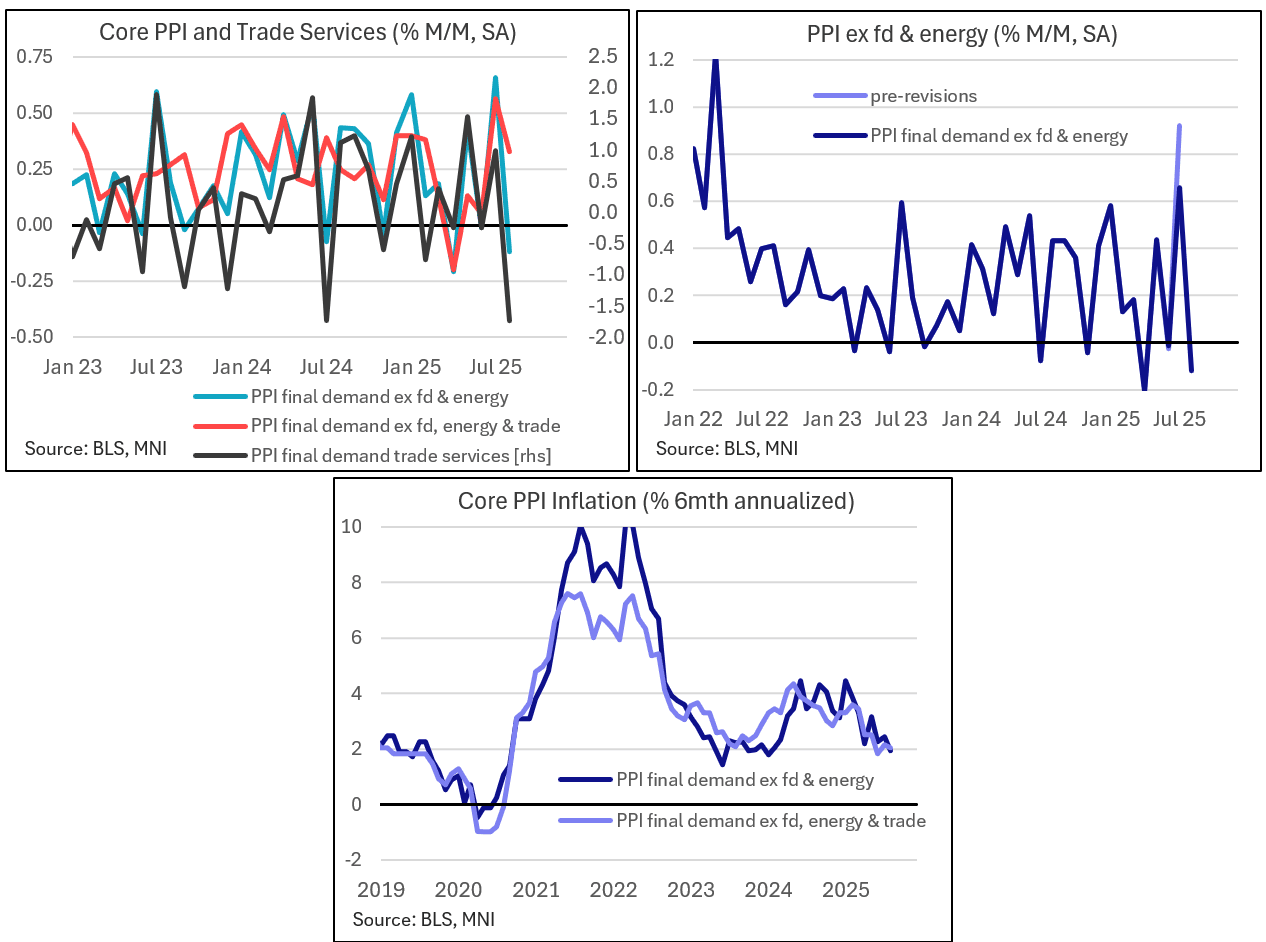
August's producer price index report showed softer price pressures compared with July, including large downside surprises in some of the main final demand metrics. The exception was an in-line ex-food/energy/trade figure which underlines uncertainty and volatility in the trade services PPI category. This report will relieve some concerns about tariff-related price pressures that arose from July's outsized PPI gains, which turn out to have been largely driven by a volatile measure.
- The main headline PPI final demand unexpectedly fell by 0.1% M/M (+0.3% expected, with a prior rev to 0.7% from 0.9% prior). The ex-food/energy metric posted identical figures, including the downward revision. This was the lowest for each since April. That meant final demand Y/Y posted just 2.6% (3.3% expected, 3.1% prior), with ex-food/energy 2.8% (3.5% expected, 3.4% prior).
- In turn, the reason for this surprisingly soft set of figures was the extremely volatile final demand trade services category, which as we noted in our preview is extremely volatile and prone to revisions. This fell 1.7% M/M (actually -1.73% unrounded, for a joint all-time low in the series that goes back to 2009).
- And as we had suggested, the prior month's 2.0% M/M rise was substantially revised down, to 1.0%, meaning that what had appeared in the initial reading to be a 39-month high is now merely a 2-month high. More on the drivers of the downside in trade services inflation and implications in the following note.
- Summing up, that meant that the "core" ex-food/energy/trade figure printed in line with expectations, at +0.3% M/M, with no revision to prior.
- Final demand goods PPI moderated to 0.1% from 0.6%, a 3-month low, with both food (0.1% after 1.4%) and energy (-0.4% after 0.7%) looking tame, and ex-food/energy dipping 0.1pp to 0.3%. There were some odd details here including a 2.3% M/M rise in tobacco prices which appears to have driven much of the upside in final demand goods, but utility natural gas prices fell 1.8%, resulting in the sequential overall energy price drop.
- On the services side, there was some notable stubbornness in transportation and warehousing (0.9% for a 2nd month for joint-highest of the year, though goods transportation/warehousing isn't dramatically elevated vs history), but "other" services moderated to 0.3% from 0.6% - which combined with plummeting trade services PPI meant overall final demand services printed a 4-month low -0.2% M/M after 0.7%.