THB: USD/THB Maintaining Positive Bias, NEER 2% Off Sep Highs
USD/THB is holding off recent highs, last in the 32.40/45 region, still up 0.20% for the session so far today. Recent highs were marked around the 100-day EMA (near 32.53). On the downside, the 50-day EMA is back at 32.24, which may now act as a support point (after being a resistance point on numerous occasions through recent months).
- Recent dovish rhetoric from the new BoT Governor- easing bias, while the FinMin has continued to call for controlling for curbing baht volatility - has likely aided further USD/THB gains, although the THB 1y1y NDIRS rate has largely tracked sideways in recent months, last under 1.00%. The weaker US Tsy yield backdrop has also done little to aid THB sentiment.
- The authorities will likely be pleased with the continued divergence between gold and USD/THB. The THB NEER (per Citi) has unwound all of its Sep gains. We are still up +1.7% for the year (but in Sep these gains were at +3.7%).
- USD/THB is not yet in overbought territory (RSI (14), last at 61.57), while the authorities may wish to see a flatter THB NEER profile for the year before tempering their THB rhetoric.
- In terms of the local data calendar, we have FX reserves tomorrow, while next Monday Sep CPI prints.
Want to read more?
Find more articles and bullets on these widgets:
Historical bullets
US: Trump To Declare A National Housing Emergency
President Trump is potentially about to declare a national housing emergency, why is this ? Below are some excerpts related to the overnight announcement:
- US (MNI): Trump May Declare National Housing Emergency In Fall - Bessent. US Treasury Secretary Scott Bessent told the Washington Examiner that President Donald Trump may declare a 'national housing emergency' this fall to address rising house prices. The Washington Examiner notes that there hasn't been a national housing emergency declared since the 2008 recession.
- John Wake on X: "Homebuilder inventory hits 2009 levels". https://t.co/FIEJgJSKnx. See Graph Below.
- Bob Elliott on X: ”Low activity and falling prices suggests the housing market is cracking at this point.”
- EndGame Macro on X: “We’re now back to the highest level of completed but unsold homes since 2009. Historically, when completed inventory rises this sharply, it’s a sign that demand is failing to keep pace. Builders don’t like to sit on finished product because every unsold house ties up capital and financing costs. The last time we saw this dynamic in 2006–2009, the oversupply collided with weakening demand and set up a multi year price correction.”
- “Based on historical precedent, inventories at this level almost always mark the start of builders offering discounts, incentives, and eventually price cuts to clear supply. In 2009, unsold inventory peaked just before the steepest leg down in home values. Today isn’t identical, credit quality is stronger, but debt loads, economic strain, and demographic headwinds point to the same pressure.”
- “Going forward, the most likely scenario is a correction, not a rebound. Housing cycles take years to play out, and this chart suggests we’re entering the phase where supply begins to overwhelm demand.” See Graph below.
- Thomas Thornton on X: “Either prices are too high or rates are too high. Lower rates artificially and will see higher home prices. You want both lower at the same time, let a recession happen.”
Fig 1: Number of Unsold Completed Homes For Sale
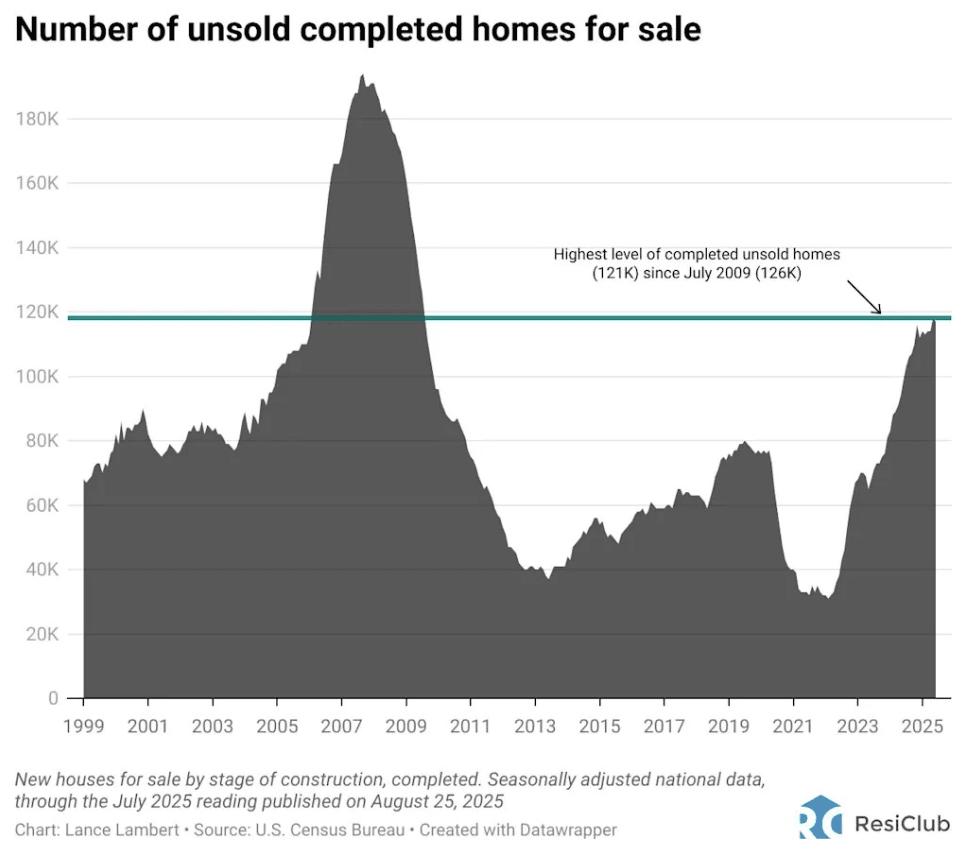
Source: MNI - Market News/@JohnWake
INDONESIA: VIEW: UOB Sees Inflation Picking Up
August headline and core inflation printed below the mid-point of Bank Indonesia’s (BI) 1.5-3.5% band. UOB warns that price pressures could “accelerate due to continued increases in gold prices and demand, rising food prices, and higher demand for non-subsidized fuel amid supply constraints”. There is also an inflationary risk from US tariffs. It is forecasting Indonesian inflation to average 2.2% in 2025 picking up to 2.5% in 2026.
- UOB notes that “Indonesia’s inflation held steady at 2.31% y/y in August, supported by rising food prices—especially rice, eggs, and cooking oil. Volatile food inflation reached 4.47% y/y, outpacing core and administered components.”
- “Inflation declined -0.8% m/m, led by lower airfares and communication equipment prices. Energy deflation also contributed, following non-subsidized fuel price adjustments. The Personal Care & Other Services category surged 8.66% y/y due to rising gold prices.”
- “Transportation costs contributed to the monthly decline, particularly airfares, which were discounted during Indonesia’s Independence Day celebrations.”
- “On the energy front, deflation was observed due to adjustments in non-subsidized fuel prices.”
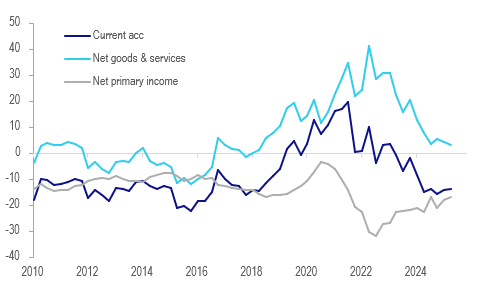
AUSTRALIA DATA: Current Account Deficits Continue, Net Exports Added 0.1pp
While Q2 recorded its ninth consecutive quarterly current account deficit, it narrowed from Q1 driven by the primary income deficit. Q2 printed at -$13.7bn after $14.1bn with primary income at -$16.8bn down from Q1’s -$18bn but the goods and services surplus was down $1.2bn at $3.1bn, the lowest in 7 years. Net exports contributed 0.1pp to Q2 growth, as expected.
Australia current account A$bn
- Given that the balance of payments data is nominal, the 4.5% q/q fall in merchandise export prices pressured the trade surplus. The goods surplus fell $1bn to $12.7bn in Q2 while services deficit rose $0.2bn to $9.6bn.
- The terms of trade fell 1.1% q/q & 2.4% y/y due to lower prices for exported coal and iron ore.
- Goods exports fell 0.9% q/q to be up 0.4% y/y driven by a 1.5% q/q decline in non-rural goods. Services exports rose 3.6% q/q & 7.9% y/y, the third consecutive quarterly increase, due to increased visits from New Zealanders.
- Merchandise imports fell 0.2% q/q in Q2 driven by a 1.2% q/q decline in capex and a 6.5% q/q in intermediate goods, as imported petroleum prices fell 11.5% in the quarter. Consumer goods imports rose 3.9% q/q & 3.8% y/y, possibly signalling some recovery in spending. Services imports increased 3.4% q/q to be up 7.8% y/y driven by overseas travel.
Australia terms of trade
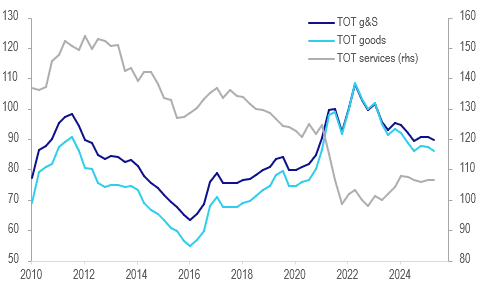
Source: MNI - Market News/ABS