USD Index (DXY) Monthly Reversal Signal

Aug-05 06:04By: Taso Anastasiou
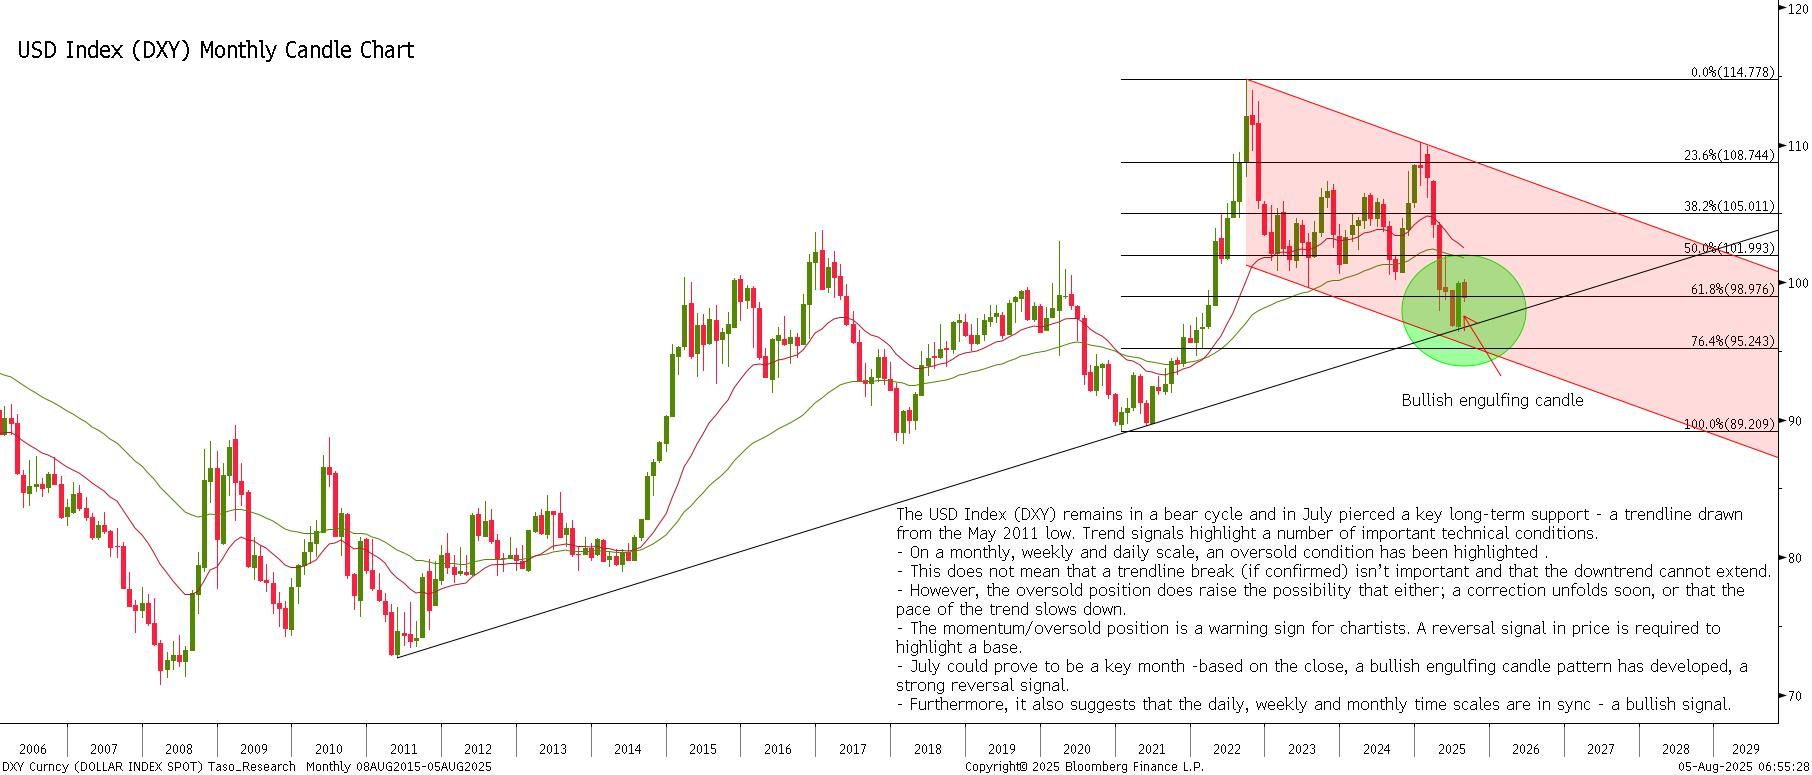
The USD Index (DXY) remains in a bear cycle and in July pierced a key long-term support at 96.55 - a trendline drawn from the May 2011 low. Trend signals highlight a number of important technical conditions.
- On a monthly, weekly and daily scale, an oversold condition has been highlighted .
- This does not mean that a trendline break (if confirmed) isn’t important and that the downtrend cannot extend.
- However, the oversold position does raise the possibility that either; a correction unfolds soon, or that the pace of the trend slows down.
- As is always the case in such situations, the momentum/oversold position is merely a warning sign for chartists. A reversal signal in price is required to highlight a base.
- July could prove to be a key month. Based on the close, a bullish engulfing candle pattern has developed.
- This is regarded as a strong reversal signal and the fact that it has occurred at the trendline, strengthens the importance of the pattern.
- Furthermore, it also suggests that the daily, weekly and monthly time scales are in sync - a bullish signal.
- Key support is at the July low of 96.38 and this price point represents an important pivot point.