USDJPY TECHS: Trend Condition Remains Overbought
May-01 18:30
- RES 4: 160.17/20 High Apr 29 / High Apr 1990
- RES 3: 159.55 2.618 proj of the Feb 1 - 13 - Mar 8 price swing
- RES 2: 158.97 2.50 proj of the Feb 1 - 13 - Mar 8 price swing
- RES 1: 158.44 HIgh Apr 26
- PRICE: 157.73 @ 16:20 BST May 1
- SUP 1: 154.58/54 20-day EMA / Low Apr 29
- SUP 2: 153.59 Low Apr 19
- SUP 3: 152.31 50-day EMA values
- SUP 4: 150.81 Low Apr 5
The USDJPY trend condition remains bullish. However, Monday’s volatile session highlights the start of a possible corrective cycle. An early rally Monday stopped short of resistance at 160.20, the Apr 1990 high. Note that the trend condition is overbought and a deeper retracement would allow the overbought set-up to unwind. Initial key support to watch lies at 154.58, the 20-day EMA. The 50-day EMA lies at 152.31.
Want to read more?
Find more articles and bullets on these widgets:
Historical bullets
US OUTLOOK/OPINION: ING on Friday's Employment Report
Apr-01 18:29
- ING economists said Friday's employment data should show a gain og +200k jobs, in-line with current Bbg estimates. Jobs creation likely "concentrated in just three sectors – local government, leisure and hospitality, and private education and healthcare services."
- ING notes "80% of all the jobs added over the past 14 months have come from these sectors and we don’t see much change given that employment surveys have pointed to a slowdown in hiring."
- Meanwhile, the unemployment rate "is expected to remain at 3.9% with wage growth remaining benign. We suspect this will keep market pricing for a June federal reserve interest cut at around 80%."
US: NY Fed Multivariate Core Trend Inflation
Apr-01 18:22
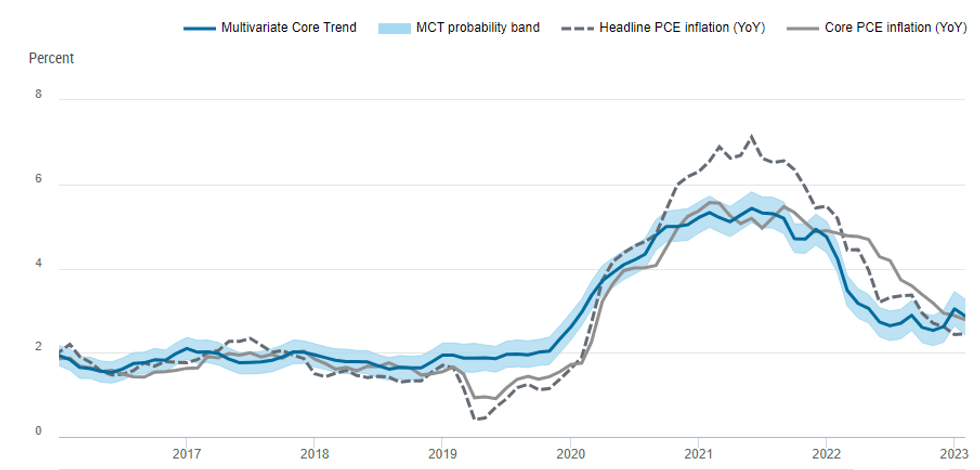
The NY Federal Reserve released their latest research on Core Trend Inflation for February:
- Multivariate Core Trend (MCT) inflation decreased to 2.9 percent in February from 3.0 percent (no revision) in January. The 68 percentile probability band is (2.4,3.3).
- Services ex. housing accounted for 0.58 percentage point (ppt) of the increase in the MCT estimate relative to its pre-pandemic average, while housing accounted for 0.43 ppt.
- The increase in the MCT estimate relative to its pre-pandemic average reflects an increase in the common trend component across the three sector aggregates of 0.47 ppt, and in the sector-specific trends of services ex. housing (0.36 ppt) and housing (0.34 ppt).
 NY Federal Reserve
STIR: BLOCK, May'24 SOFR Put Sale
Apr-01 18:14
- -12,000 SFRK4 94.75 puts, 2.0 ref 94.83 at 1404:18ET
- Update to earlier put condor on screen:
- -22,500 SFRM4 94.75/94.81/94.87/94.93 put condors 1.0-1.25 ref 94.82