USDJPY: The Yen is once again at the forefront going into the European hours
* The Yen is once again the Currency that stands out going into the European hours. * USDJPY fell ...
Want to read more?
Find more articles and bullets on these widgets:
Historical bullets
USD: The Yen is testing broader lows into the EU session
- The Yen is the early mover going into the European session, with the Currency extending early broader lows despites the Hawkish leaning Minutes from the BoJ overnight.
- The Yen is the worst early performer against the Dollar, but the Currency is also testing fresh intraday lows against the the GBP, EUR and AUD.
- Immediate resistance in the USDJPY is unchanged at 158.58 38.2% retracement of the Jul 23 - Aug 3 bear leg.
- AUDJPY is testing the 50% retrace of the whole July/August range of 111.95, now looking to test the 112.00 handle.
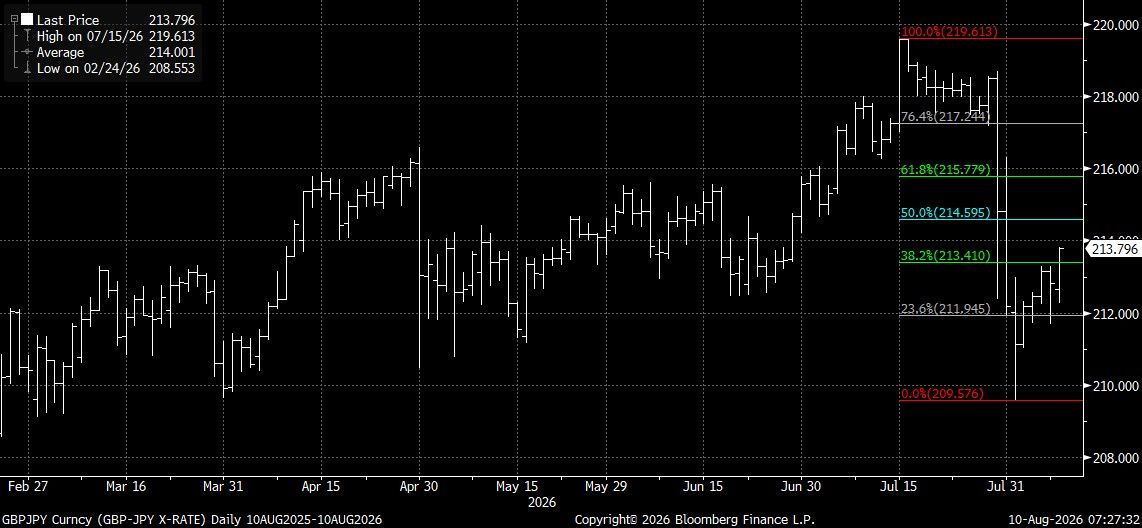
- GBPJPY would see the same retracement level much further out and back up to 214.60.
(Chart source: MNI/Bloomberg Finance LP).
WTI TECHS: (U6) Retracement Mode
- RES 4: $100.00 - Psychological round number
- RES 3: $95.30 - High May 18 and the bull trigger
- RES 2: $94.02 - High May 21
- RES 1: $79.70/93.50 - 50-day EMA / High Jul 23 and key resistance
- PRICE: $78.07 @ 07:20 BST Aug 10
- SUP 1: $74.24 - Low Aug 5
- SUP 2: $73.35 - 76.4% retracement of the Jul 2 - 23 bull leg
- SUP 3: $67.12 - Low Jul 2 and the bear trigger
- SUP 4: $64.89 - 76.4% retracement of the Dec 16 - May 18 bull leg
WTI futures traded sharply lower last Tuesday marking an extension of the current bear cycle and corrective phase. The move down opens $73.35, a Fibonacci retracement point. Clearance of this level would strengthen the bear cycle and expose key support and the bear trigger at $67.12, the Jul 2 low. For bulls, a reversal higher would highlight the end of the correction and refocus attention on $93.50, the Jul 23 high and key resistance.
NORWAY: Less Retracement In Food and Goods Inflation Than Expected In July
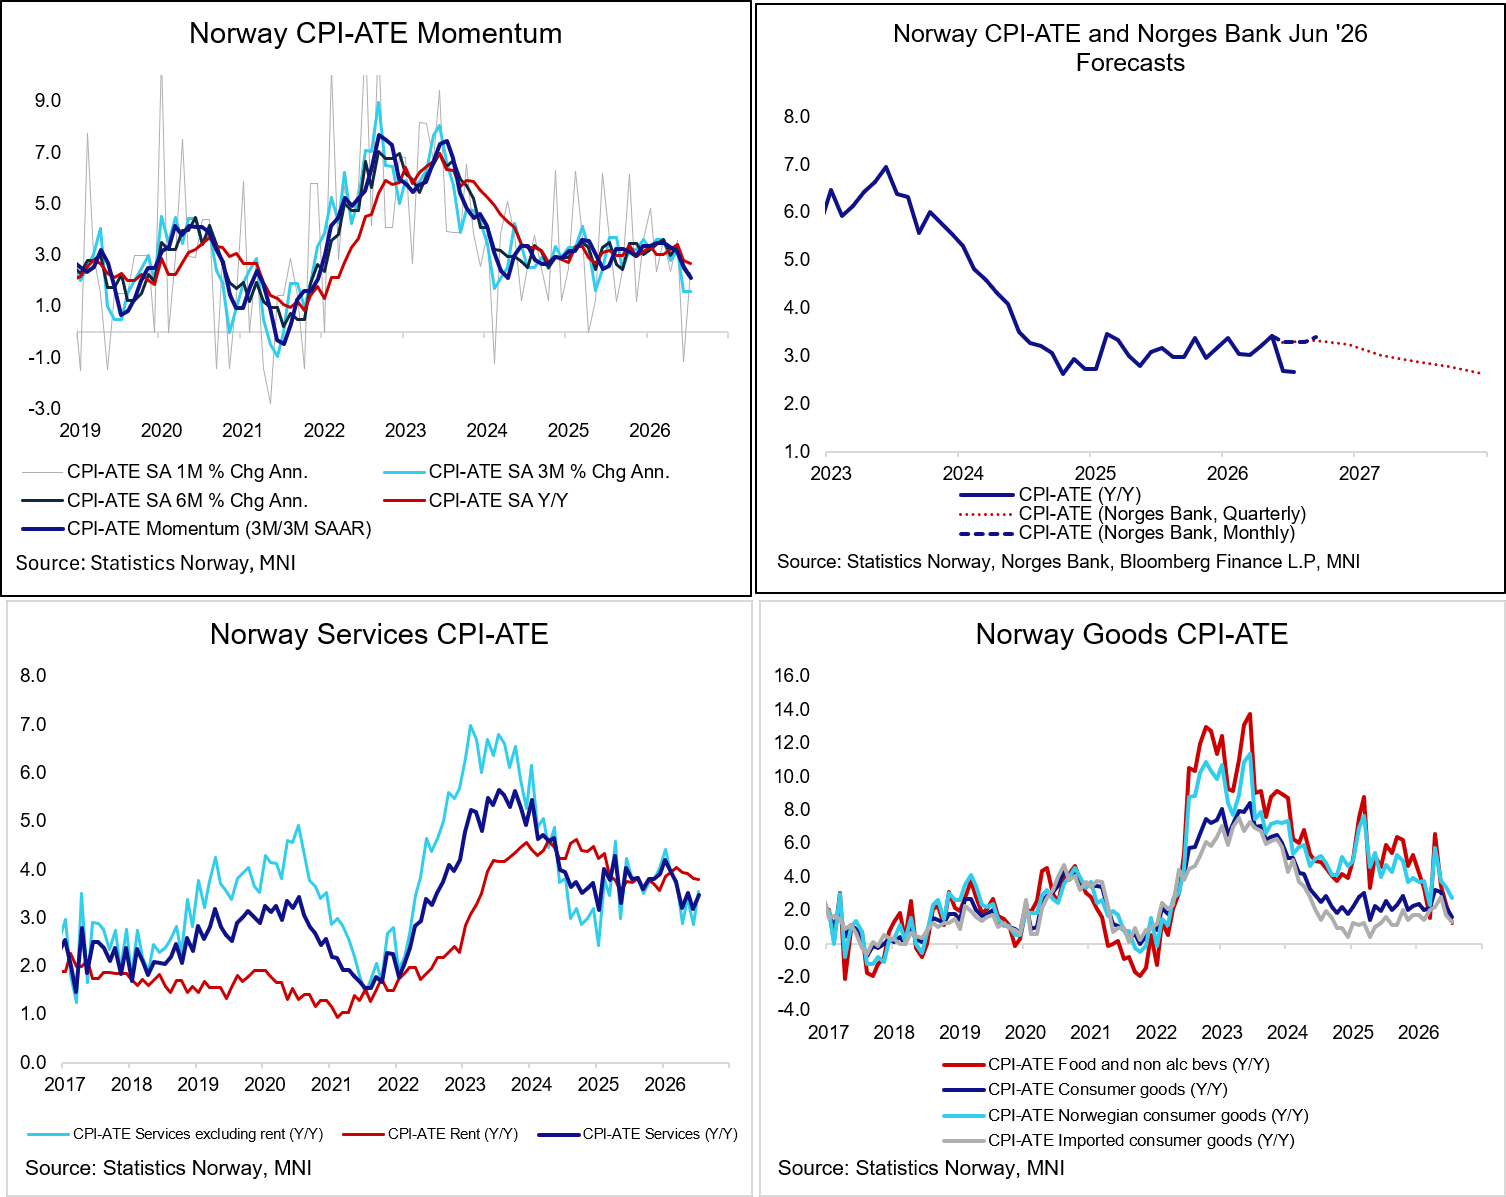
Decelerations in food and goods inflation offset a rebound in services in July, leaving CPI-ATE inflation steady and below analyst consensus. This may affirm consensus for a Norges Bank hold on Thursday, but focus will remain on the guidance. On a seasonally adjusted basis using stats Norway data, CPI-ATE inflation rose 0.2% in July, after -0.1% in June. This pulled 3m/3m annualised inflation momentum down to 2.1%, the lowest since May 2024.
Services inflation rose to 3.5% Y/Y (vs 3.2% prior), with rents steady at 3.8% Y/Y and services ex-rent at 3.5% Y/Y (vs 2.9% prior). Services where labour dominates excluding regulated prices (a reasonable measure of wage-led, underlying inflation pressures), ticked up to 3.8% Y/Y (vs 3.7% prior), and so remains quite sticky. Services with other important price components excluding administered prices was 5.4% Y/Y (vs 4.6% in June, 5.7% in May).
- Looking at volatile items: There was a rebound in both airfares (2.9% Y/Y vs -4.0% prior) and package holidays (3.0% Y/Y vs -2.8% prior) in July, though accommodation services pulled back notably to 1.7% Y/Y (vs 4.7% prior).
- Cultural services (3.0% Y/Y vs 3.3% prior) and insurance (15.4% Y/Y vs 16.6% prior) eased a little.
Goods inflation was soft at 1.6% Y/Y (vs 2.2% prior), with domestic goods easing to 2.7% Y/Y (vs 3.4% prior) and imported goods at 1.3% Y/Y (vs 1.7% prior). Imported goods have reversed upward momentum seen in Q1, potentially a function of the stronger exchange rate.
- There was another deceleration in food inflation in July to 0.9% Y/Y (vs 2.3% prior). The 3.1% M/M rise was within the range of analyst estimates we had seen.
- Information processing equipment was -2.5% Y/Y after 4.8% in June (-5.2% M/M). Some analysts had expected this category to rebound partially after a notable decline in June.
- Clothing and footwear inflation accelerated to 2.9% Y/Y (vs 2.6% prior), but furnishings and household equipment pulled back to 0.5% Y/Y (vs 2.3% prior).