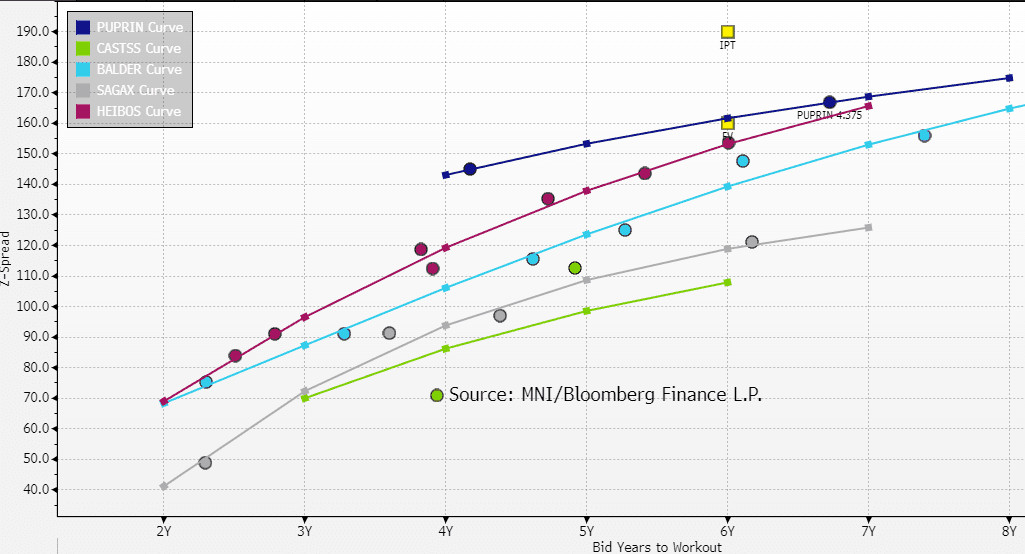
EU REAL ESTATE: Public Property Invest: 6yr IPT (PUPRIN; NR/NR/BBB)
• IPT: Exp. €300m 6yr ms+190/195 (market sources)
• FV: ms+160
• FV taking into consideration static secondary levels. Yesterday's Alstria deal seemed to show some reticence to buy after a strong rally.
• Comps are mid-BBB Scandi names but Public Property does have some unique features with a particularly high quality tenant base. One note of caution is that the 2024 Prospectus made it clear that they wanted to be opportunistic in buying assets from forced sellers who are struggling to refinance. They will be acquisitive going forward.
• Last issued €350m Long 7yr in June ms+215; screening z+164 now.
Want to read more?
Find more articles and bullets on these widgets:
Historical bullets
EURIBOR OPTIONS: Z5 Call Spread vs Put Structure Buyer
ERX5 98.125/98.3125 call spread vs 98.00 put, paper buys the call spread and pays 0.25 in +5.32k
- ERZ5 is currently 98.035. The X5 options expire on November 14, so capture the ECB's October 30 decision.
- The trade would benefit from a deterioration in Eurozone activity/inflation data between now and that meeting, which would argue for a more dovish ECB stance than currently expected.
- Although markets still just about lean in favour of one more 25bp cut this cycle, that's not fully priced at any point over the next 12 months.
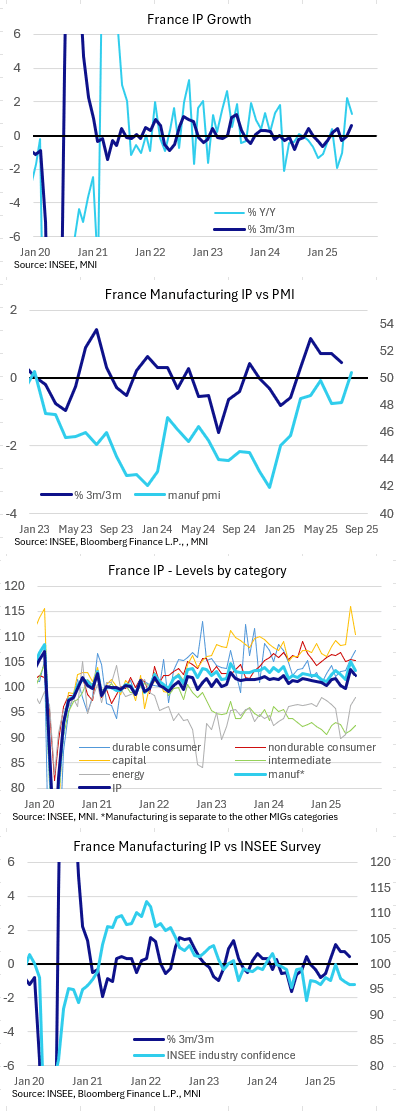
FRANCE DATA: July IP Higher Than Cons Due to Energy / Water; Manufacturing Soft
July France industrial production was stronger than expected, at -1.1% M/M (-1.4% consensus). This followed the strong June (3.7%, revised from 3.8%). However, it appears as though it is energy and water / sewerage driving the upside surprise here with manufacturing softer-than-expected.
- Underlying manufacturing was weaker than the headline print this time, at -1.6% M/M, the lowest sequential reading since May 2024. On a 3m/3m comparison, the sector remains up, at 1.5% (2.6% prior).
- Capital goods production was the mover behind manufacturing, at -4.8% M/M following the very strong +7.0% from June. In July, production fell "in the manufacture of transport equipment (-10.7%) after jumping in June (+16.3%). The decline in this sector was mainly due to the decline in aeronautical and space construction, following a peak in production in June", Insee comments. However, this category in index terms was still the second highest it has been post-Covid, so there could be further pull back next month.
- Durable consumer goods meanwhile were strong again in July, posting their fourth consecutive increase in production, at 1.7% M/M (2.1% prior). Non-durable consumer goods were -0.2% M/M (0.3% prior), while intermediate consumer goods came in at 1.0% M/M (0.6% prior).
- Outside of manufacturing "electricity, gas, steam and air-conditioning supply" rose 1.8%M/M after 5.0%M/M last month (almost matching the high since 2022 in index terms seen in December 2024). Water and sewerage fell 0.9%M/M after the 3.5% rise in June which in index terms is still 2.7% above the Jan-May level. We think that most analysts would have expected further pull back in these categories and these were the main drivers of the upside IP surprise.
- On a yearly comparison, IP was 1.3% (0.7% cons, 2.2% prior, revised from 2.0%).
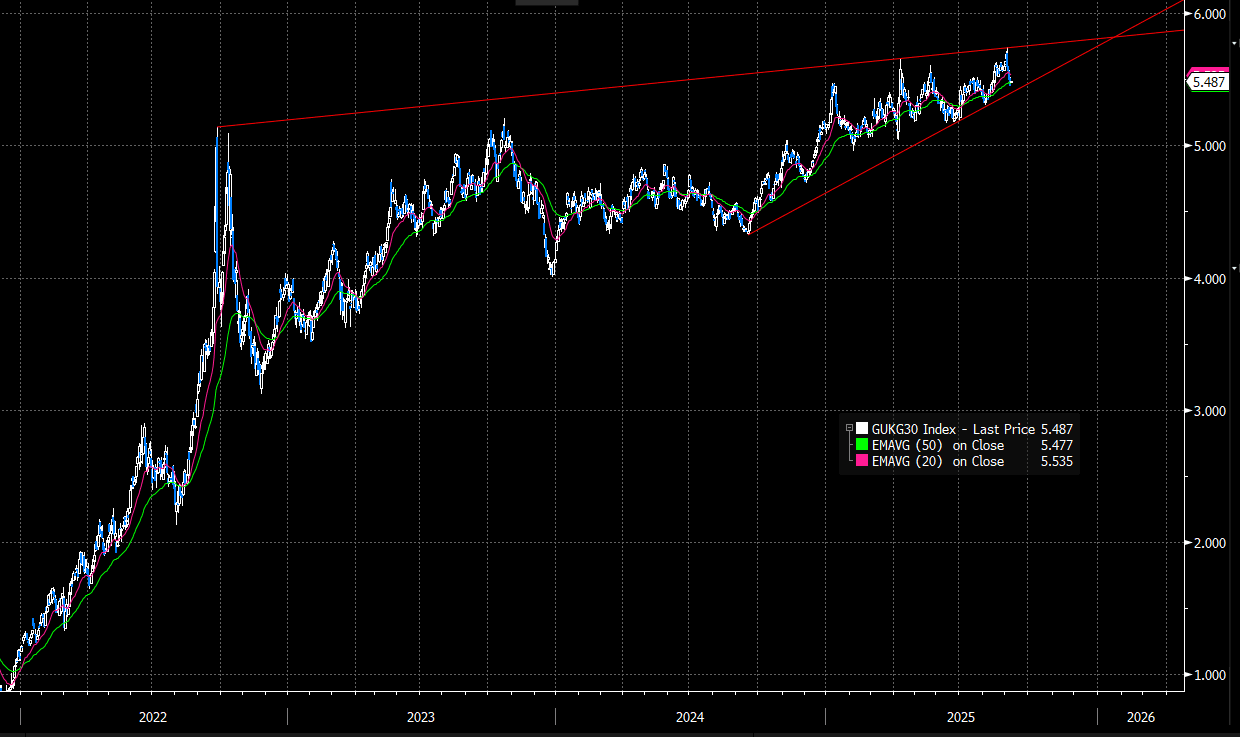
GILTS: Uniform Shift Higher In Curve; Yield Trendline Support Intact For 10s/30s
- The UK curve has seen a fairly uniform shift higher this morning, with yields 2.5-3bps higher across the curve. Gilts underperform Bunds across tenors.
- Although the past four sessions have seen a relief rally in (particularly long-end) Gilts, it’s worth remembering that the technical trend for yields is still to the topside. Both 10s and 30s remain underpinned by trendline support drawn from the September 2024 lows (see charts)
- Gilt futures are -22 ticks at 91.33. However, initial support is not seen till 90.65, the Sep 5 low.
- BRC like-for-like shop sales were 2.9% Y/Y in August, above three analyst estimates ranging from 1.5-2.5%. However, with goods inflation (particularly food inflation) running at a fast pace, sales look a lot less impressive and there may be some boost here from calendar effects.
- The DMO will sell GBP1.75bln of the 4.75% Oct-43 Gilt at 1000BST.
- In our latest Gilt Week Ahead, we look at the recent changes in both UK politics and the potential impacts from the upcoming Labour deputy leader contest. See here
- We will also be focusing on the take up of the STR and ILTR following the gilt redemption; how the market reacts could feed into the MPC's September QT decision.
- SONIA futures are flat to -2.0 ticks through the blues, performing broadly in line with Euribor counterparts. BOE-dated OIS continue to price ~10bps of easing through year-end, with the next full 25bp cut not fully discounted until March.
- Next week’s labour market and inflation data remain vital for the near-term BOE outlook.
Figure 1: 10-year Gilt Yields (Source: Bloomberg Finance L.P)
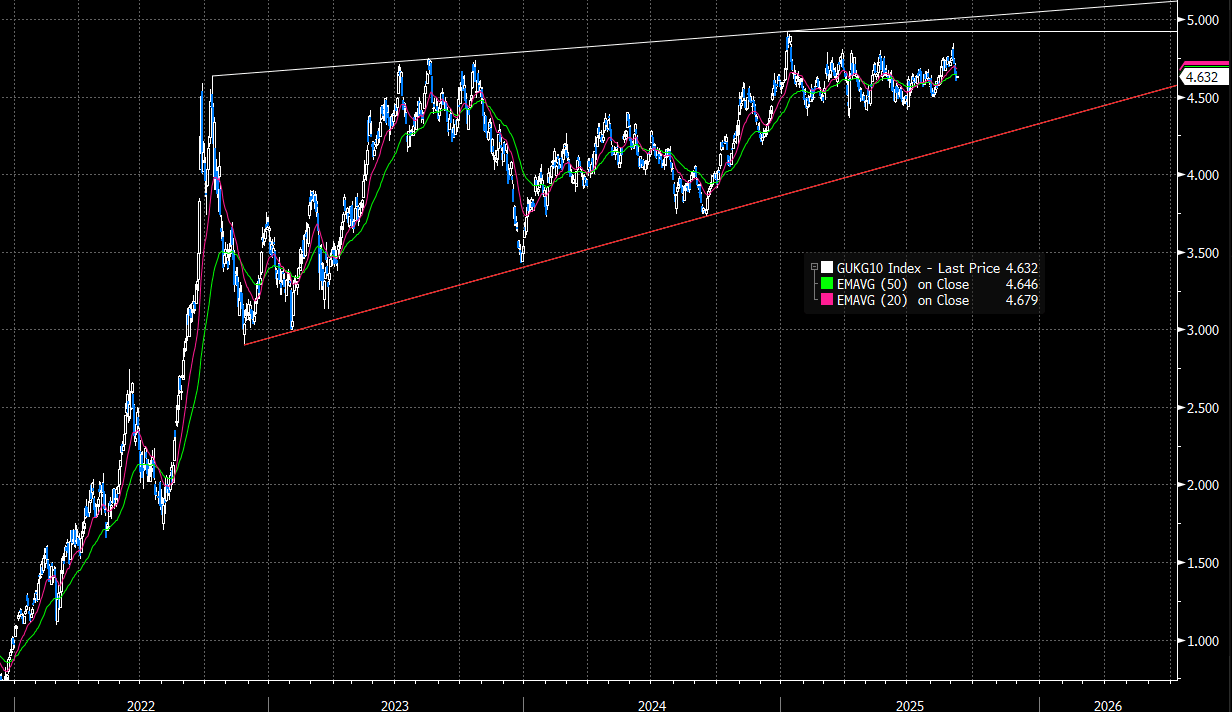
Figure 2: 30-year Gilt Yields (Source: Bloomberg Finance L.P)