EM LATAM CREDIT: MNI EM Credit Market Wrap - LATAM (22 May)
Source: BBG
Measure Level Δ DoD
5yr UST 4.10% -6bp
10yr UST 4.54% -6bp
5s-10s UST 43.7 +0bp
WTI Crude 60.9 -0.7
Gold 3291 -23.8
Bonds (CBBT) Z-Sprd Δ DoD
ARGENT 3 1/2 07/09/41 856bp +1bp
BRAZIL 6 1/8 03/15/34 256bp +1bp
BRAZIL 7 1/8 05/13/54 367bp +1bp
COLOM 8 11/14/35 410bp -1bp
COLOM 8 3/8 11/07/54 501bp +1bp
ELSALV 7.65 06/15/35 440bp +18bp
MEX 6 7/8 05/13/37 276bp +1bp
MEX 7 3/8 05/13/55 341bp +2bp
CHILE 5.65 01/13/37 156bp +2bp
PANAMA 6.4 02/14/35 332bp +4bp
CSNABZ 5 7/8 04/08/32 556bp +5bp
MRFGBZ 3.95 01/29/31 271bp +13bp
PEMEX 7.69 01/23/50 636bp +1bp
CDEL 6.33 01/13/35 213bp +5bp
SUZANO 3 1/8 01/15/32 212bp +2bp
FX Level Δ DoD
USDBRL 5.66 +0.02
USDCLP 942.55 -1.23
USDMXN 19.3 -0.06
USDCOP 4175.34 -1.22
USDPEN 3.66 -0.02
CDS Level Δ DoD
Mexico 121 2
Brazil 166 1
Colombia 228 3
Chile 58 1
CDX EM 96.84 0.10
CDX EM IG 100.87 0.06
CDX EM HY 92.74 0.11
Main stories recap:
Comments
· Relief rally in U.S. Treasuries now that the House passed the tax bill with attention turning to debate in the Senate and concerns about debt sustainability persisting.
· EM Asia benchmark credit spreads widened about 8 bps while CEEMEA showed a similar pattern.
· The primary market in Asia and CEEMEA quieted down while LATAM picked up with two more Argentina new issues hitting the market, both with sizeable concessions.
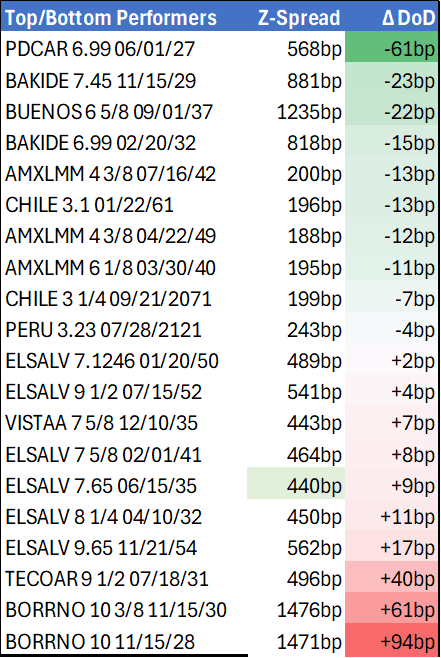
· LATAM benchmark spreads were also wider, by about 1-4bps on average though there were a few outliers like El Salvador that widened 18 bps and Marfrig that was 13 bps wider.
Want to read more?
Find more articles and bullets on these widgets:
Historical bullets
US DATA: TGA Steadies Over $600B As Tax Receipts Continue To Roll In
The Treasury General Account rose $26B Friday and Monday, and at $626B is nearing the $639B recent high set post-April 15 tax day.
- April's tax receipts so far have been robust, toughly 20% above the cumulative amounts at this stage of the 2024 tax year, with the TGA up a similar amount vs a year prior.
- We reiterate that the ongoing tax take in this crucial month looks healthy enough to alleviate concerns that the x-date will be moved earlier rather than later.


CANADA DATA: Industrial Price Pressures Remain Elevated
Industrial product prices rose 0.5% M/M (NSA) in March, representing stronger price pressures than expected (0.3% survey, 0.6% prior upwardly revised by 0.2pp). While there was no consensus on the Y/Y rates, the index rose 4.7% on that basis, a slight pullback from 5.1% prior.
- The overall M/M story was of energy and petroleum products marking disinflationary progress (and Y/Y energy prices fell 4.9%), but were outweighed by several other commodity groups tha per StatCan "posted significant increases".
- In particular, non-ferrous metal product prices rose 3.8% M/M (led by aluminum/gold/silver), and lumber/wood products up 3.1% M/M (fastest since November 2024). These in turn reflected both market pressures (StatCan attributed the precious metals increase to "continued political instability fuelling safe-haven investment demand", with other products impacted by tariff uncertainty including for lumber and copper.
- Overall raw materials prices conversely fell 1.0% M/M (+0.1% survey, 0.3% prior, no revision), with the Y/Y rise of 3.9% showing continued disinflationary progress from 9.2% prior for a 4-month low - but still a fifth consecutive Y/Y rise.
- Raw materials ex-energy/petroleum product inflation remained elevated on a Y/Y basis but decelerated to 14.7% from 16.1% prior (which was a 34-month high).
- Overall, the broad measures of pipeline price pressures remain elevated. While IPPI looks to be topping out, core measures are mixed, with ex-energy remaining in the 6% area and raw materials ex-energy in double-digits. It's unclear to what degree this will pull back in April, with price developments since March being mixed (gold higher, copper and lumber softer, for example).


USDCAD TECHS: Trend Needle Points South
- RES 4: 1.4415 High Apr 1
- RES 3: 1.4296 High Apr 7
- RES 2: 1.4180 50-day EMA
- RES 1: 1.3906/4052 High Apr 17 / 20-day EMA
- PRICE: 1.3819 @ 16:21 BST Apr 22
- SUP 1: 1.3781 Low Apr 21
- SUP 2: 1.3744 76.4% retracement of Sep 25 ‘24 - Feb 3 bull run
- SUP 3: 1.3696 Low Oct 10 2024
- SUP 4: 1.3643 Low Oct 9 ‘24
A bearish theme in USDCAD remains intact for now. Fresh trend lows continue to highlight a resumption of the downtrend and signal scope for a continuation near-term. Potential is seen for a move towards 1.3744, a Fibonacci retracement. Moving average studies are in a bear-mode position, highlighting a dominant downtrend. First resistance to watch is 1.4052, the 20-day EMA.