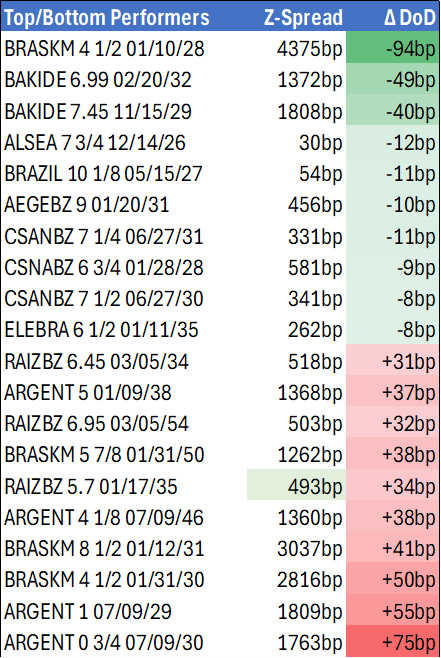
EM LATAM CREDIT: LATAM Credit Market Wrap
Source: Bloomberg Finance L.P.
Measure Level Δ DoD
5yr UST 3.55% -7bp
10yr UST 3.97% -5bp
5s-10s UST 42.3 +1bp
WTI Crude 57.6 -0.7
Gold 4294 +86.5
Bonds (CBBT) Z-Sprd Δ DoD
ARGENT 3 1/2 07/09/41 1246bp +25bp
BRAZIL 6 1/8 03/15/34 234bp +4bp
BRAZIL 7 1/8 05/13/54 321bp +4bp
COLOM 8 11/14/35 336bp -1bp
COLOM 8 3/8 11/07/54 393bp -2bp
ELSALV 7.65 06/15/35 392bp +5bp
MEX 6 7/8 05/13/37 226bp +4bp
MEX 7 3/8 05/13/55 272bp +4bp
CHILE 5.65 01/13/37 132bp +2bp
PANAMA 6.4 02/14/35 248bp +5bp
CSNABZ 5 7/8 04/08/32 613bp +25bp
MRFGBZ 3.95 01/29/31 270bp +16bp
PEMEX 7.69 01/23/50 495bp +8bp
CDEL 6.33 01/13/35 194bp +4bp
SUZANO 3 1/8 01/15/32 184bp +5bp
FX Level Δ DoD
USDBRL 5.44 -0.01
USDCLP 955.95 -5.11
USDMXN 18.4 -0.03
USDCOP 3850.16 -44.92
USDPEN 3.39 -0.02
CDS Level Δ DoD
Mexico 98 4
Brazil 147 2
Colombia 207 2
Chile 56 3
CDX EM 97.51 (0.12)
CDX EM IG 101.23 (0.06)
CDX EM HY 93.15 (0.05)
Main stories recap:
· Treasury yields fell 4-8bp in a bull steepening move driven by systemic U.S. bank loan portfolio credit concerns that triggered a decline in major U.S. equity indexes.
· The EM primary market continued to be active but not nearly at the hectic pace of previous weeks with one new issue each for Asia, CEEMEA and LATAM.
· EM secondary benchmark bond spreads were little changed in Asia and generally tighter in CEEMEA but around midday U.S. equity indexes started to react more negatively which drove Treasury yields lower and spreads wider for LATAM.
· Bonds of Brazil’s Raizen gave up some gains made earlier in the week, widening about 30bp with credit concerns still in focus.
Want to read more?
Find more articles and bullets on these widgets:
Historical bullets
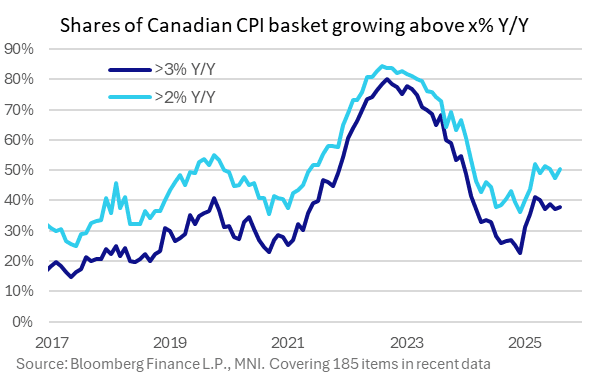
CANADA: Services Inflation Breadth Showing Signs Of Moderating
Dispersion measures showed a mixed picture of inflationary pressures in August.
- The share of all items (185 tracked by MNI) seeing faster than 2% inflation picked up to 50.3%, returning to June's level after a dip to a 5-month low 47.6% in July.
- The proportion above 3% was basically steady (37.8% after 37.3%) but the 4+% category narrowed to 29.2% of the basket after 30.3% in each of the prior 5 months.
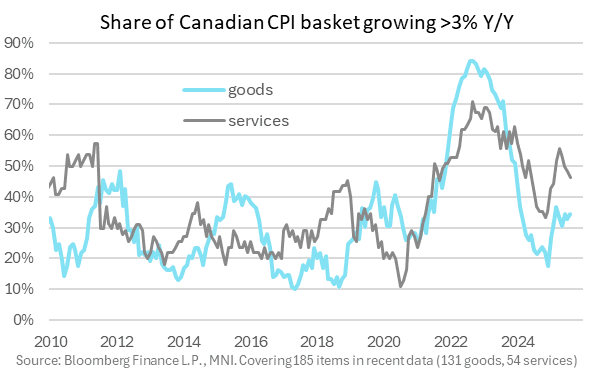
- Breaking out goods vs services:
- Items rising above 2% picked up for goods to 32.4% from 30.3% prior for a fresh 5-month high (which looks energy-related), with that for services only up mildly at 17.8% vs 17.3% prior.
- Above 3% and the divergence was more stark: goods in that bracket rose to 34.4% (32.8% prior), but for services the proportion fell to a 6-month low 46.3%, the 4th consecutive sizeable decline.
- And above 4%, 18.9% of goods were in that category, unchanged for the last 3 months - but for services, the proportion fell to 10.3%, the lowest since February.
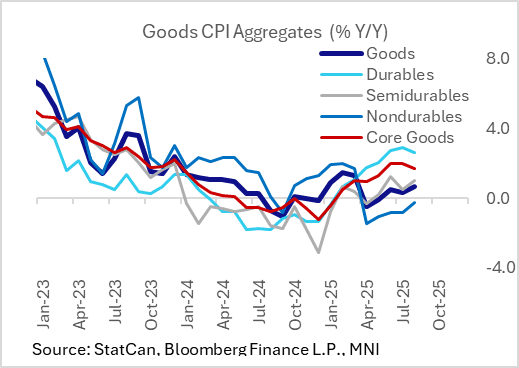
CANADA: Underlying CPI Details Include Softer Core Goods Theme
While the broader trend of softening in the major core CPI metrics were reinforced in August's inflation report, the category-by-category details also will have added some encouragement for the BOC that price pressures are at worst steadying out and potentially set to moderate.
Goods: Goods price inflation continued to pick up: August marked a 5-month high 0.7% Y/Y (0.3% prior), however core goods pressures dipped for the first time since April, at 1.7% Y/Y after 2 months at 2.0%.
- Durable goods inflation - which had been seen as a warning sign for trade war-related price pressures - faded. Most notably, vehicle and household furniture prices saw less upside pressure than in previous months.
- And as the headline/core divergence suggests, it was food (3.4% after 3.3%) and energy (-8.3% after -10.4% for the "highest" since March, before the consumer carbon tax reprieve) that helped fuel at least part of the pickup. Ex-energy inflation fell to 2.6%, a 4-month low, after 2.7% the two prior months.
- As such, nondurables goods inflation picked up to -0.3% Y/Y after -0.8% for a 5-month high.
- Semi-durables inflation picked up as well to 1.0%, from 0.5% prior. This category - which includes household textiles, kitchen utensils, clothing, footwear, jewellery, fabrics, photographic equipment, and toys and games - includes clothing which saw a pickup in Y/Y inflation to 2.1% from -0.3%, highest in 50 months.
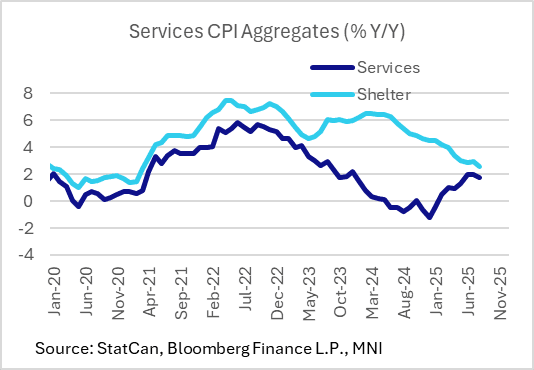
Services: Services prices inflation was flat at 2.8% Y/Y, a joint 6-month low.
- Importantly, shelter prices resumed their descent after July's surprise tick higher (2.6% after 3.0%, a fresh 52-month low), as rented accommodation inflation more than reversed July's jump to 5.0%. Owned accommodation inflation fell to 2.3% from 2.5%, a 54-month low, as mortgage interest and replacement costs continued to disinflate.
- Non-shelter services ticked higher though despite a decline in travel services, with household communications and personal care services contributing to upside.
US OUTLOOK/OPINION: Macro Since Last FOMC - Prices: But Somewhat Contained [2/2]
- That being said, latest readthrough to core PCE inflation paints a less hawkish picture. With August CPI and PPI inputs to hand, analyst unrounded estimates appear to be centered around core PCE inflation of 0.20% M/M, or at least a median around there with a risk of being a little higher.
- If accurate, that would follow 0.27% M/M in July and 0.26% M/M in June, implying some moderation after a string of more clearly above-target prints. Assuming no revisions, it would see year-ago core PCE inflation of 2.9% Y/Y (vs 2.7% in January at the start of the Trump administration) and with a three-month rate only modestly higher at 3.0% annualized.
- The median FOMC forecast from June eyed an average 3.1% Y/Y for 4Q25.
- For broader context, monthly tariff revenues were worth circa 1.8% of overall personal consumption expenditure after a 1.3pp increase under the Trump administration. This only gives a sense of aggregate potential adjustment, with the burden split across importers, businesses and consumers. This aggregate impact has room to increase further judging by actual tariff revenue as a share of imports compared to effective tariff rates.
