EM LATAM CREDIT: LATAM Credit Market Wrap
Source: Bloomberg Finance L.P.
Measure Level Δ DoD
5yr UST 3.71% -4bp
10yr UST 4.24% -3bp
5s-10s UST 52.8 +1bp
WTI Crude 63.9 +0.7
Gold 3395 +1.1
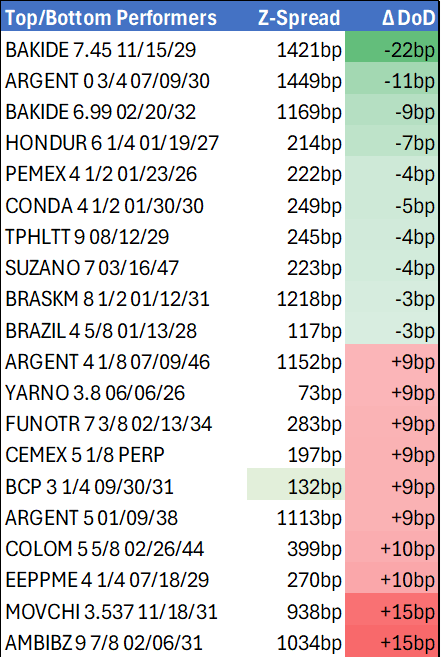
Bonds (CBBT) Z-Sprd Δ DoD
ARGENT 3 1/2 07/09/41 1095bp +10bp
BRAZIL 6 1/8 03/15/34 246bp +0bp
BRAZIL 7 1/8 05/13/54 338bp -2bp
COLOM 8 11/14/35 370bp +7bp
COLOM 8 3/8 11/07/54 440bp +6bp
ELSALV 7.65 06/15/35 418bp +3bp
MEX 6 7/8 05/13/37 248bp +0bp
MEX 7 3/8 05/13/55 300bp +1bp
CHILE 5.65 01/13/37 143bp +2bp
PANAMA 6.4 02/14/35 269bp +3bp
CSNABZ 5 7/8 04/08/32 568bp +4bp
MRFGBZ 3.95 01/29/31 265bp +2bp
PEMEX 7.69 01/23/50 536bp +4bp
CDEL 6.33 01/13/35 201bp +2bp
SUZANO 3 1/8 01/15/32 177bp +4bp
FX Level Δ DoD
USDBRL 5.42 -0.01
USDCLP 968.35 +2.14
USDMXN 18.7 -0.00
USDCOP 4030.54 -24.24
USDPEN 3.55 +0.01
CDS Level Δ DoD
Mexico 96 0
Brazil 139 (1)
Colombia 198 3
Chile 51 (0)
CDX EM 98.02 (0.03)
CDX EM IG 101.43 (0.05)
CDX EM HY 94.49 (0.05)
Main stories recap:
· Ahead of today’s Nvidia earnings report, U.S. equity indexes moved higher even as the new 50% U.S. tariff on India took effect.
· U.S. Treasury yields inched 2bp lower despite a 5-year Treasury note auction that tailed about 1bp as the market awaited an update on U.S. 2nd quarter GDP tomorrow that was expected to move slightly higher to 3.1% from the advance print of 3% reported a month ago, according to Bloomberg.
· The EM primary market followed through from yesterday’s reawakening with more financial deals from across the globe.
· Out of Asia we saw KDB print a EUR 3-year, then we saw a flurry of GCC subordinated debt from Saudi Arabian banks as well as an AT1 from a top Turkish bank. Lastly, we saw LATAM development bank CAF price a 7-year EUR bullet. Demand was strong for all the deals, with pricing generally at the tighter end of fair value estimates.
· CEEMEA benchmark bond spreads meandered in a narrow range while LATAM spreads widened.
· Argentina sovereign bonds underperformed again, widening about 10bp, as the corruption scandal continued to weigh on the market coupled with concerns about a ARS9Tn local bond auction today.
Want to read more?
Find more articles and bullets on these widgets:
Historical bullets
USDCAD TECHS: Either Side of 50-day EMA
- RES 4: 1.3920 High May 21
- RES 3: 1.3862 High May 29
- RES 2: 1.3798 High Jun 23
- RES 1: 1.3729/74 50-day EMA / High Jul 17
- PRICE: 1.3730 @ 19:47 BST Jul 28
- SUP 1: 1.3557 Low Jul 03
- SUP 2: 1.3540 Low Jun 16 and the bear trigger
- SUP 3: 1.3503 1.618 proj of the Feb 3 - 14 - Mar 4 price swing
- SUP 4: 1.3473 Low Oct 2 2024
Despite a recovery from last week’s lows and a further phase of strength Monday, the trend needle in USDCAD continues to point south and short-term gains appear corrective. Markets have traded either side of resistance at 1.3728, the 50-day EMA. A clear break of this average is required to highlight a possible stronger short-term reversal. For bears, sights are on key support at 1.3540, the Jun 16 low. Clearance of this level would confirm a resumption of the downtrend.
AUDUSD TECHS: Approaching Support At The 50-Day EMA
- RES 4: 0.6700 76.4% retracement of the Sep 30 ‘24 - Apr 9 bear leg
- RES 3: 0.6688 High Nov 7 ‘24
- RES 2: 0.6677 0.764 proj of the Jun 23 - Jul 11 - 17 price swing
- RES 1: 0.6625 High Jul 24
- PRICE: 0.6517 @ 19:45 BST Jul 28
- SUP 1: 0.6513 Low Jul 28
- SUP 2: 0.6505/6455 50-day EMA / Low Jul 17
- SUP 3: 0.6373 Low Jun 23 and a bear trigger
- SUP 4: 0.6357 Low May 12
Last week’s fresh trend highs in AUDUSD reinforce bullish conditions and the latest pullback is considered corrective. Gains have resulted in a print above key short-term resistance at 0.6595, the Jul 11 high and bull trigger. This marks a resumption of the uptrend and sights are on 0.6688, the Nov 7’ 24 high. Support to watch is at the 50-day EMA, at 0.6505. A clear break of this EMA would highlight a stronger reversal.
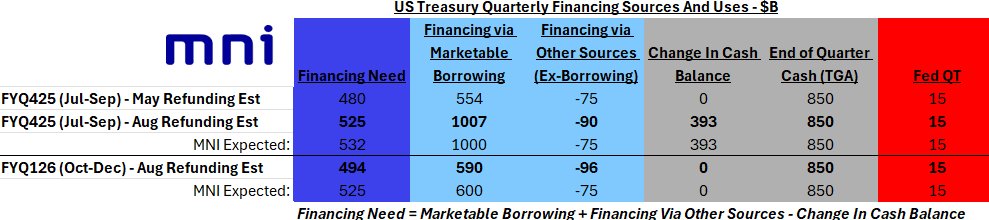
US TSYS/SUPPLY: Borrowing Requirements Upped In Line With MNI Expectations
Treasury's estimates of privately-held net marketable borrowing for the July - September 2025 and October - December 2025 quarters released Monday were almost exactly in line with MNI's estimates (Sources and Uses Table here - PDF).
- We would characterize the current quarter borrowing estimates as slightly on the high side of the median analyst expectation, with the latter quarter fairly close to expectations given what is usually a wide range for the further-out quarter. As such this should have little to no impact on expectations for Wednesday's Refunding announcement.
- For the Jul-Sep quarter, Treasury expects a $525B financing need (MNI expected $532B) with a $1007B borrowing requirement (MNI expected $1000B), with cash rising $393B to $850B by quarter-end (in line with consensus). Analyst borrowing requirement estimates for this quarter ranged from $942B - $1,087B.
- This represents a borrowing estimate $60B higher than announced in April's refunding, when excluding the cash raise that is now expected following the lifting of the federal debt limit ($453B more borrowing this quarter on $393B more cash by end-quarter).
- For the Oct-Dec quarter, Treasury expects a $494B financing need (MNI expected $525B) with a $590B borrowing requirement (MNI expected $600B), with cash remaining at $850B at quarter-end. Analyst borrowing requirement estimates for this quarter ranged from $534B - $726B.
- Note that regarding the April-June quarter, "excluding the lower than assumed end-of-quarter cash balance, actual borrowing was $56 billion lower than announced in April".