CANADA: July BOC Cut Pricing: From Distinct Possibility To Negligible This Week
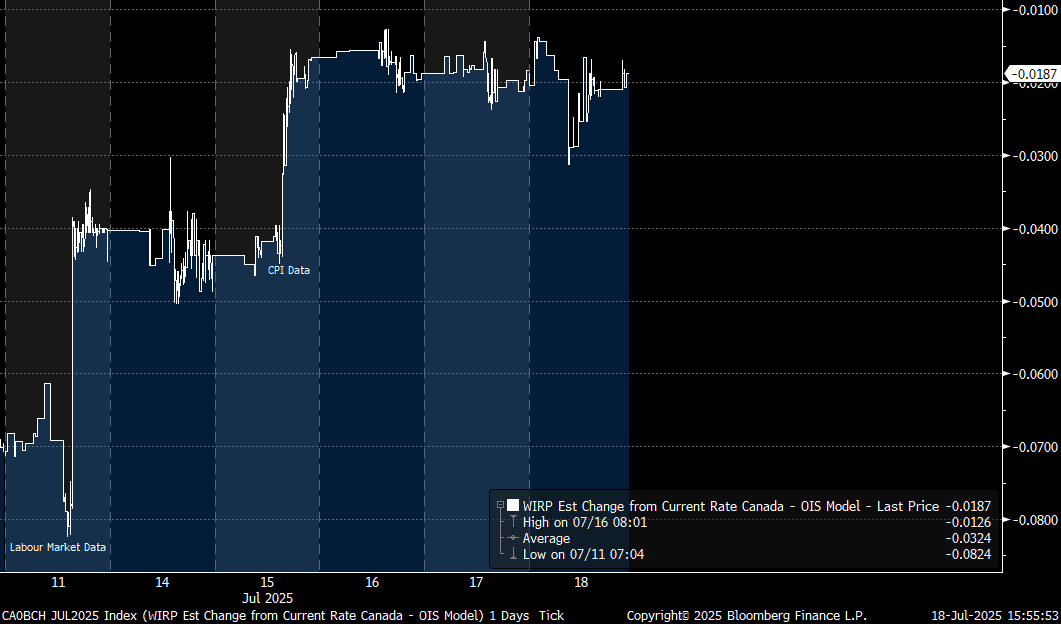
The implied probability of a July BOC rate cut has gone from a distinct possibility to negligible this week, following Tuesday's firmer-than-expected core inflation data.
- The accompanying chart shows implied pricing (in percentage points) for July's BOC decision - it dropped from around 30% implied (7+bp) prior to the labour market report last Friday, to under 20% going into CPI (4+bp), reducing after that to under 10% (<2bp).
- For the year as a whole, markets have priced out about 15bp of cuts through those two data points - now seeing about 15bp of easing through December. As such, it's very much in question whether the BOC's easing cycle is already at an end.
- Apart from the ongoing US-Canada trade negotiations, next week's scheduled highlight will be the BOC's Business Outlook Survey out Monday, followed by May Retail Sales out Thursday which will be the final major input into the macro puzzle for the BOC going into its decision on July 30.
| Meeting | Current | Last week's close (Jul 09) | Change since then | Cumulative Change From Current Rate (bp) |
| Jul 30 2025 | 2.74 | 2.68 | 5.6 | -1.9 |
| Sep 17 2025 | 2.69 | 2.60 | 9.3 | -6.0 |
| Oct 29 2025 | 2.65 | 2.53 | 12.1 | -10.5 |
| Dec 10 2025 | 2.61 | 2.45 | 15.7 | -14.6 |
Want to read more?
Find more articles and bullets on these widgets:
Historical bullets
MNI: US TSY TICS NET FLOWS IN APR -$14.2B
- MNI: US TSY TICS NET FLOWS IN APR -$14.2B
- US TSY TICS NET L-T FLOWS IN APR -$7.8B
USDCAD TECHS: Path Of Least Resistance Remains Down
- RES 4: 1.4200 Round number resistance
- RES 3: 1.4111 High Apr 4
- RES 2: 1.3843/1.4016 50-day EMA / High May 12 and 13
- RES 1: 1.3713 20-day EMA
- PRICE: 1.3688 @ 15:55 BST Jun 18
- SUP 1: 1.3540/3517 Low Jun 16 / 1.0% 10-dma envelope
- SUP 2: 1.3503 1.618 proj of the Feb 3 - 14 - Mar 4 price swing
- SUP 3: 1.3473 Low Oct 2 2024
- SUP 4: 1.3410 1.764 proj of the Feb 3 - 14 - Mar 4 price swing
The trend needle in USDCAD points south and fresh cycle lows last week and again on Monday, reinforce a bearish theme. Short-term gains are considered corrective. Support at 1.3686, the May 26 low and a bear trigger, has been cleared, confirming a resumption of the downtrend. This maintains the price sequence of lower lows and lower highs. Sights are on 1.3517 next, envelope-based support. Resistance at the 20-day EMA is at 1.3713.
US TSYS: Late SOFR/Treasury Option Roundup
Mixed SOFR & Treasury option flow on net, underlying futures well off initial gap bid post FOMC, curves mildly steeper while projected rate cut pricing gains slightly on longer dates vs. this morning's levels (*) as follows: Jul'25 at -2.6bp (-3.6bp), Sep'25 at -18.7bp (-17.7bp), Oct'25 at -31.6bp (-29.1bp), Dec'25 at -48.2bp (-45.1bp).
- SOFR Options:
- +3,000 SFRH6 95.50 puts, 3.0 vs. 96.325/0.10%
- +2,500 SFRZ5 96.25/96.37/96.62/96.75 call condors, 1.75
- -1,000 SFRZ5 96.12 straddles, 42.5
- +4,000 SFRU5 95.68/95.81/96.00/96.12 put condors, 4.5
- +2,000 SFRZ5 95.75 puts, 3.75
- -5,000 SFRN5 95.68/95.81 put spds, 1.75 ref 95.89
- Pit/screen over +55,000 SFRU5 95.50/95.62 put spds, .25 ref 95.86, bid for more
- 3,700 SFRZ5 96.25/96.50 call spds vs. 95.68 puts ref 96.115
- -3,000 0QN5 97.25/97.31 call strip vs. SFRN5 96.50/96.56 call strip, cab net 0QN over
- +4,000 SFRQ5 95.68/95.75 put spds, 2.5 ref 95.855
- +5,000 0QH6 97.25/98.00 call spds, 13.0 vs. 96.745/0.18%
- 2,000 SFRV5 96.18/96.43 call spds ref 96.09
- 2,800 SFRU5 95.93/96.00/96.06 call flys
- +3,000 SFRU5 95.56/95.62/95.68 put flys, 1.25 ref 95.86
- +12,800 SFRH6 96.50/97.00/98.00 broken call flys, 2.5 ref 96.32 to -.33
- 1,600 3QZ5 96.25/96.62/97.00 call flys, 8.0
- Treasury Options: (July serial options expire Friday)
- 5,000 FVU5 111 calls, 10.5 ref 108-07.75 to -08
- 2,500 TUN5 103.25/103.37/103.5/103.62 put condors, ref 103-22
- 1,250 FVN5 108.25/108.5/109/110 broken call condors ref 108-09.75
- 1,800 FVN5 107.25/107.75/108.25 put flys ref 108-09.5
- 2,000 USU5 114/116/118 call flys ref 114-06
- +5,000 TYQ5 110.5/111.5/112 1x3x2 call flys 4 over TYQ5 112/113/113.5 1x3x2 call flys
- +2,000 TYQ5 114.5 calls, 8
- -3,000 TYN5 110.75 calls, 16 vs 110-22.5/0.50%
- +3,000 TYN5 111.5 calls, 6
- +1,500 Wed wkly TY 110.75/111/111.25 call flys, 3.0
- +6,500 Wed wkly FV 107.5/107.75 put spds, 1 (exp today)
- +2,000 TYN5 110.5/111/111.5 call flys, 8