FED: Fed Balance Sheet Tracker: Stage Set For QT “Pause”
We go through the current state of the Fed’s balance sheet with a stylized scenario of reserve balances over the next six months in our Fed Balance Sheet tracker (link).
- Fed balance sheet runoff policy is set to shift in 2025 – and perhaps slightly earlier than the mid/late year dates previously anticipated. A pause in QT looks increasingly likely, perhaps announced by May.
- Our Tracker updates on market expectations for QT’s end: while there is increasing focus on a QT pause/slowdown announced by May’s FOMC meeting, there remain some expectations that the Fed can wait until after the summer before calling time on balance sheet rundown, either temporarily or permanently.
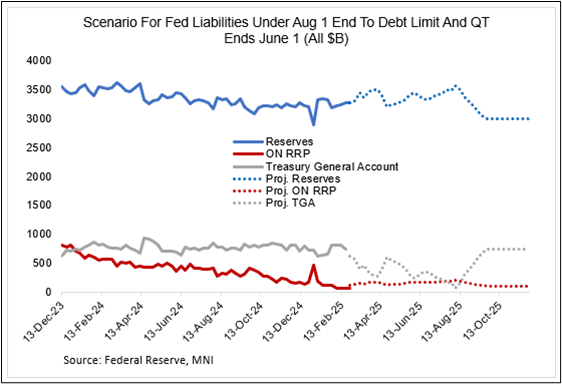
- Under a stylized scenario (see chart), in which the debt limit is lifted in late July/early August, and QT ends June 1 as some analysts had previously been expecting, reserve balances pick up sharply in the summer as Treasury cash runs out, peaking at around $3.6T, before dropping sharply to $3T by September as the TGA is rebuilt. That might be too volatile for the Fed's comfort.
- The Fed is probably looking to play it safely. And for those members of the FOMC who want to see the balance sheet reduced as much as possible, a pause (not a slowdown) may be the safest strategy: it would allow runoff to resume later once the signals are clearer, and avoid a situation where net purchases need to restart, potentially allowing QT to go further and longer.
- The March meeting is possible but may be too early absent clear signals of reserve scarcity - a May announcement ahead of June 1 implementation of a temporary runoff pause looks logical particularly given the looming Q2 quarter-end/month-end.
Want to read more?
Find more articles and bullets on these widgets:
Historical bullets
US DATA: House Prices Losing Some Steam Amid Weak Sales Activity
House price gains came in a little stronger than expected in November, with the S&P Corelogic 20-City aggregate rising 0.41% M/M (0.30% expected), and prior revised up 0.03pp to 0.35%.
- However the FHFA price index was merely in line at 0.3% M/M and decelerated from 0.5% prior.
- And both aggregates - while still solid on a Y/Y basis - have decelerated from recent highs. The S&P CL Y/Y metric was 4.3%, up from 4.2% prior, but well off the 10+% readings in summer 2023; likewise the FHFA Y/Y at 4.2% (a 17-month low) was well below the 8-9% readings of summer 2023.
- The momentum indices are mixed: for the FHFA, momentum has picked up moderately (3M SAAR at 6.0% in Nov, an 8-month best), but S&P momentum fell to the weakest in 18-months (3.8%).
- To be sure, prices remain buoyant: the S&P index hit an 18th consecutive all-time high. But as the FHFA noted re the weakening Y/Y rises, “The slowdown in price growth is likely due to higher mortgage rates contributing to cooling demand", while S&P Dow Jones identified "below-trend" growth in prices.
- Higher rates have not dampened prices. But we continue to highlight historically weak sales activity - amid high mortgage rates - inhibiting price discovery, perhaps best seen in some of the lowest inventories-to-sales ratios in modern history for existing homes.
- Again, it will probably take a sharp drop in mortgage rates, a rise in unemployment - or both - for the housing market to get out of its prolonged period of stasis.

US TSY FUTURES: BLOCK: Late March'25 5Y/10Y Ultra Curve Steepener
Curve steepener blocked after the bell at 1524:00ET, DV01 $375,000:
- +9,000 FVH5 106-16.75, post time offer vs.
- -4,300 UXYH5 111-18, sell through 111-18.5 post time bid
AUDUSD TECHS: Resistance At The 50-Day EMA Holds Firm
- RES 4: 0.6441 38.2% retracement of the Sep 30 - Jan 13 downleg
- RES 3: 0.6429 High Dec 12
- RES 2: 0.6384 High Dec 13
- RES 1: 0.6325/6331 50-day EMA / High Jan 24
- PRICE: 0.6248 @ 16:38 GMT Jan 28
- SUP 1: 0.6209 Low Jan 21
- SUP 3: 0.6165/31 Low Jan 17 / 13 and the bear trigger
- SUP 3: 0.6100 Round number support
- SUP 4: 0.6045 1.500 proj of the Sep 30 - Nov 6 - 7 price swing
A medium-term bearish trend condition in AUDUSD remains intact and recent gains have stalled at resistance around the 50-day EMA, at 0.6325. The reversal lower suggests the possible end of the correction between Jan 13 - 24. A continuation lower would open 0.6131, the Jan 13 low and the bear trigger. On the upside, a clear breach of the 50-day average is required to signal scope for a stronger recovery.