SWEDEN: Direct and Portfolio Investment Inflows In Q1; CA Surplus Rises
Jun-05 11:09
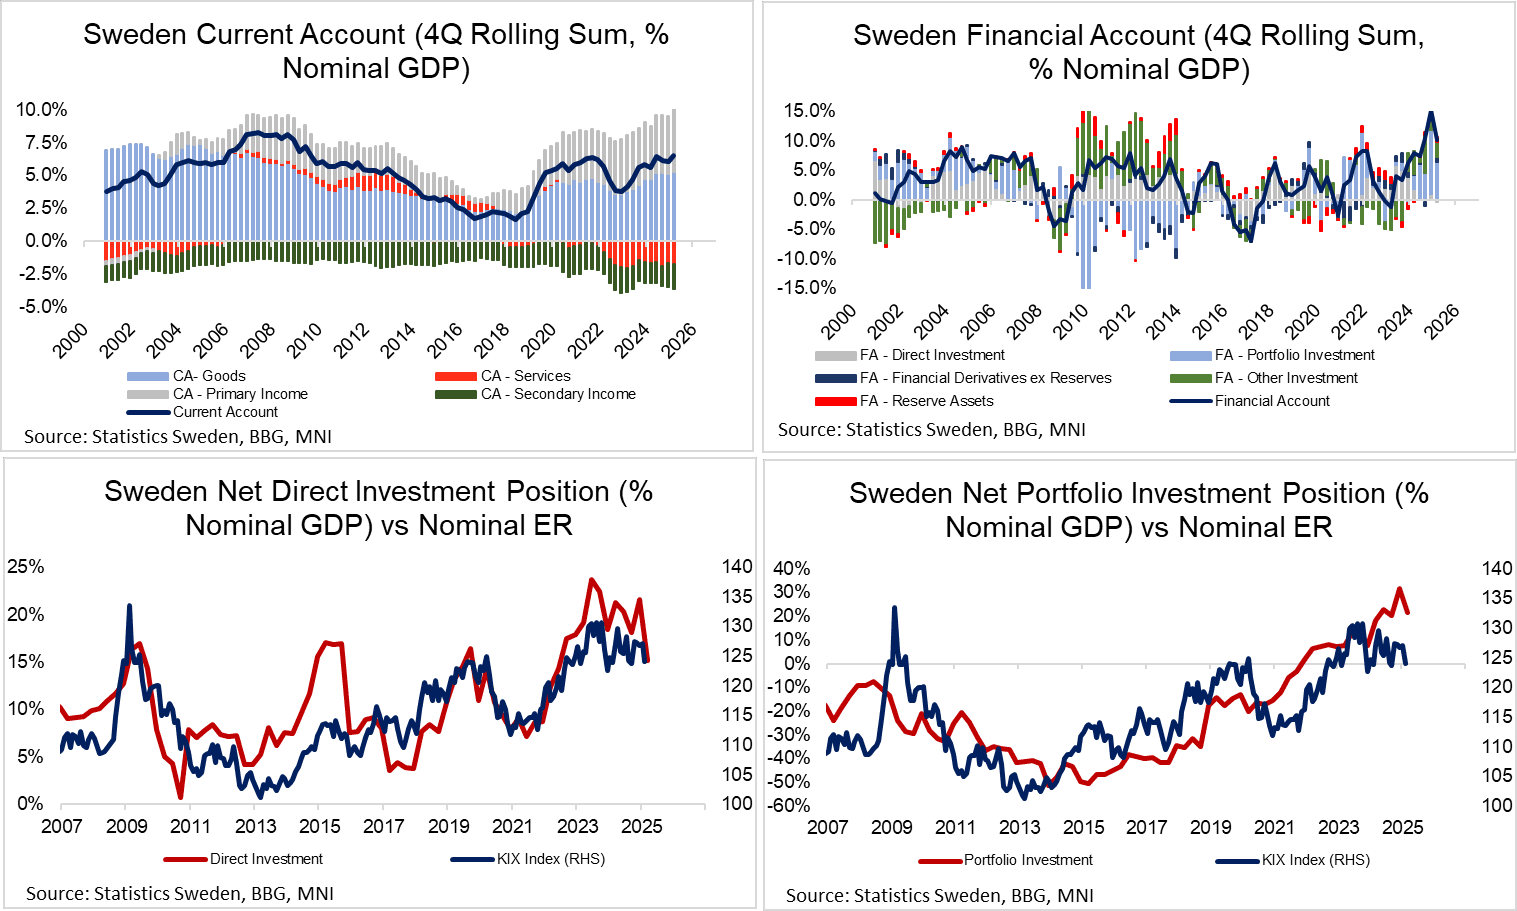
The Swedish Q1 current account surplus widened to SEK119.3bln, with last quarter’s reading seeing a notable downward revision to SEK81.2bln (vs SEK111.9bln initial). On a 4Q rolling basis, the current account surplus was 6.5% of nominal GDP, up from 6.0% last quarter for the highest since Q2 2009.
- An expansion of the goods trade surplus to SEK101.7bln (vs 85.6bln in Q4) - a record high in nominal terms – drove the widening. The goods surplus was 5.3% of GDP on a 4Q rolling basis (vs 5.1% prior). The services deficit was steady in nominal and % GDP terms (1.7%).
- The primary income surplus widened to 4.9% GDP (vs 4.4% prior), while the secondary income deficit widened to 1.9% (vs 1.8% prior).
- The financial account actually registered a SEK129bln net inflow (net errors and omissions for the quarter was a sizeable -SEK248bln). Within this, there were direct investment inflows of SEK86bln and portfolio investment inflows (mostly equities) of SEK90bln.
- In the case of portfolio investment, there are two factors to consider: (1) The value of foreign asset holdings (such as US equities) fell alongside broader stock indices. (2) There was an increase in capital being reallocated/repatriated out of the US and into the likes of Sweden through Q1. The latter dynamic was touted as a key driver of SEK strength during this period.
- As a 4Q rolling sum to GDP, direct investment was essentially neutral, while Sweden still registers a net portfolio investment outflow of 6% (vs 11% in Q4 2024).
- The Swedish net international investment position fell to 52% in Q1 from 68% in Q4, but remains well above the pre-2019 period when Sweden was a net debtor.
Want to read more?
Find more articles and bullets on these widgets:
Historical bullets
SONIA: Some Condor sellers
May-06 11:02
- SFIK5 95.80/95.90/96.00/96.10c condor sold at 6 in 5k.
- SFIM5 96.00/96.15/96.30/96.45c condor, sold at 3.75 in 7.5k
OUTLOOK: Price Signal Summary - WTI Gains Considered Corrective
May-06 11:01
- On the commodity front, Gold has recovered from its recent lows and this suggests the correction between Apr 22 - May 1, is over. A continuation higher would refocus attention on key resistance and the bull trigger at $3500.1, the Apr 22 high. Clearance of this level would confirm a resumption of the primary uptrend. Key short-term support has been defined at $3202.0, the May 1 low. A break of this level is required to signal scope for a deeper retracement. First support to watch is $3252.1, the 20-day EMA.
- In the oil space, a medium-term bearish trend in WTI futures remains intact and short-term gains are considered corrective. The move down that started Apr 23 signals the end of the correction between Apr 9 - 23. That cycle higher allowed an oversold condition to unwind. Attention is on $54.67, the Apr 9 low and a bear trigger. Clearance of this level would resume the downtrend and open $53.72, a 2.236 projection of the Feb 20 - Mar 5 - Apr 2 price swing. Resistance to watch is $64.32, the 50-day EMA.
OUTLOOK: Price Signal Summary - USDJPY Trend Needle Points South
May-06 10:50
- In FX, recent weakness in EURUSD appears corrective. The trend structure remains bullish - moving average studies are in a bull-mode position signalling a dominant uptrend. The latest move down has also allowed an overbought condition to unwind. A resumption of gains would open 1.1608, the Nov 9 2021 high. Initial key support to watch is the 20-day EMA, at 1.1269. A break of this average would signal scope for a deeper pullback.
- The latest pullback in GBPUSD appears corrective. A tweezer top formation on the daily candle chart last Monday/Tuesday, highlights a short-term top. Firm support at 1.3232, the 20-day EMA, remains intact. A break of this level would signal scope for a deeper retracement. Note that moving average studies are in a bull-mode position, signalling a dominant underlying uptrend. A resumption of gains would open 1.3510, a 1.236 projection of the Feb 28 - Apr 3 - 7 price swing.
- The trend direction in USDJPY remains bearish and gains since Apr 22 are considered corrective. Price remains below resistance at the 50-day EMA, at 146.49. A clear break of this average would highlight a possible reversal. Moving average studies remain in a bear-mode position highlighting a dominant downtrend. A resumption of the trend would open 139.79 next, a 1.382 projection of the Feb 12 - Mar 11 - 28 price swing. First key support to watch is 141.97, the Apr 29 low.