EM ASIA CREDIT: Adani Ports: Business update, cargo volumes up
(ADSEZ, Baa3neg/BBB-neg/BBB-neg)
"*ADANI PORTS SEPT. CARGO VOLUME 41.6M TONS" - BBG
"*ADANI PORTS SEPT. CARGO VOLUME +11%" - BBG
"*ADANI PORTS SEPT. CONTAINER VOLUME +14%" - BBG

Want to read more?
Find more articles and bullets on these widgets:
Historical bullets
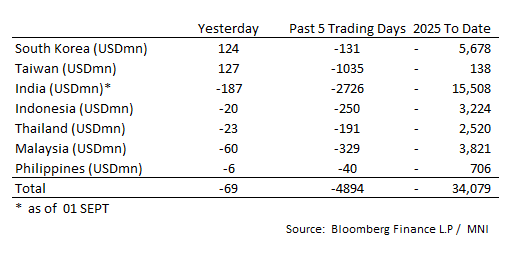
ASIA STOCKS: Large Outflows Moderate
Outflows from India continues, as others see modest inflows.
- South Korea: Recorded inflows of +$124m yesterday, bringing the 5-day total to -$131m. 2025 to date flows are -$5,678. The 5-day average is -$26m, the 20-day average is -$28m and the 100-day average of +$49m.
- Taiwan: Had inflows of +$127m yesterday, with total outflows of -$1,035 m over the past 5 days. YTD flows are negative at -$138. The 5-day average is -$207m, the 20-day average of -$180m and the 100-day average of +$176m.
- India: Had outflows of -$187m as of the 1st, with total outflows of -$2,726m over the past 5 days. YTD flows are negative -$15,508m. The 5-day average is -$545m, the 20-day average of -$225m and the 100-day average of -$15m.
- Indonesia: Had outflows of -$20m yesterday, with total outflows of -$250m over the prior five days. YTD flows are negative -$3,224m. The 5-day average is -$50m, the 20-day average +$30m and the 100-day average -$12m.
- Thailand: Recorded outflows of -$23m yesterday, with outflows totaling -$191m over the past 5 days. YTD flows are negative at -$2,520m. The 5-day average is -$38m, the 20-day average of -$31m and the 100-day average of -$14m.
- Malaysia: Recorded outflows as of -$60m yesterday, totaling -$329m over the past 5 days. YTD flows are negative at -$3,821m. The 5-day average is -$66m, the 20-day average of -$41m and the 100-day average of -$12m.
- Philippines: Recorded outflows of -$6m yesterday, with net outflows of -$40m over the past 5 days. YTD flows are negative at -$706m. The 5-day average is -$8m, the 20-day average of -$4m the 100-day average of -$5m.
BONDS: NZGBS: Back End Yields Notably Higher, 2/10s Curve At +148bps
NZGB yields are flat to 6bps higher, led by the back end of the curve. The steepening theme evident globally has been seen strongly today in NZGB markets. The 2yr yield is barely changed and anchored sub 3.0% at this stage. The 10yr yield is up close to 6bps, last at 4.46% and closing the gap with pre RBNZ highs from August close to 4.50%. These moves leave the NZGB 2/10s curve at +148bps, closing in on April highs near +154bps.
- US Tsy futures initially moved higher in Wednesday Asia Pac trade, but this move has been faded. Cash Tsy yields sit 1-2bps higher in yield terms, with the back end leading. The US 2/10s curve sits at +63bps.
- Outside of US moves, NZ markets have also likely been impacted by ACGB yield gains. These were supported post the better than expected Q2 GDP print (although ACGB front end yields are notably higher, up 9bps for the 2-3yr tenors, compared to NZ's flat 2yr trend today).
- NZ's 2yr swap rate has edged a little higher, last near 2.775%.
- On the news front: " S&P Global Ratings is “comfortable” with New Zealand’s sovereign rating outlook, though it’s closely watching the nation’s current account and budget deficits." (via BBG).
- Data wise, the ANZ August commodity price index rose 0.7%m/m, after a -1.8% fall in July. Overnight we did have a softer whole milk powder auction result though.
GLOBAL MACRO: Indicators Suggest Global IP Growth Continued In Q3
The August JP Morgan global manufacturing PMI printed at 50.9 up from 49.7 signalling growth in activity in the sector again and at its fastest since May 2024. The pickup was driven particularly by higher output but also domestic orders and a return to hiring but confidence remained below average. The PMI, LME metal prices and the Baltic Freight Index (BFI) are all consistent with global IP and trade growth remaining at current rates or possibly improving.
Global growth
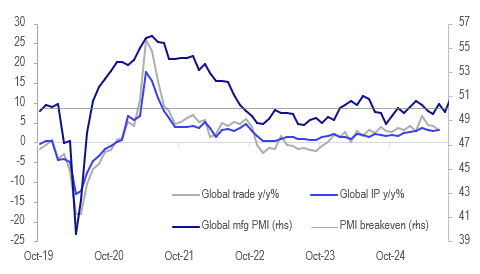
Source: MNI - Market News/LSEG/Bloomberg Finance L.P.
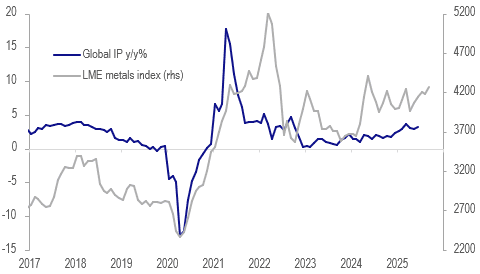
- CPB global IP growth rose 0.4% m/m in June driving a 0.4pp improvement in annual growth to 3.2% y/y, the strongest since March which was boosted by the frontloading of deliveries to the US ahead of tariff deadlines. June global trade rose 3% y/y down from 4.1% y/y.
Global IP y/y% vs LME metals
- August output in the JP Morgan PMI rose to 51.7 from 49.7 helped by orders up 1.1 points to 50.9. All sectors saw growth. However the increase was driven by domestic demand and export orders continued to contract but at a slower rate but tariff worries remained a problem, according to JP Morgan.
- The increase in demand likely drove an improvement in employment with it marginally returning to growth territory at 50.2.
- The resumption of output growth in manufacturing was also across most countries with only 5 continuing to see contraction. India, Thailand, Spain and the US saw strong growth.
- Cost inflation rose to its highest rate since February driving a marginal pickup in selling price inflation with the US reporting the fastest rate.