Copper/Gold Ratio Breaking Down, But Tsy Yields Haven't (2/2)
Jun-20 08:01By: Tim Cooper
Oil Bullets+ 1
For most of the last couple of decades, the copper/gold ratio has been a coincident and sometimes leading indicator for large moves in US Treasury yields (as a proxy for general economic activity vs safe-haven trade).
- Looking at it charted below, it's only really since early 2021 that the correlation has broken down.
- At that time, the copper/gold ratio suggested a Tsy yield closer to 2.5%, but it remained well below 2%; now it's suggesting a rate closer to 2% but 10Y Tsys are trading closer to 3.20% (and indeed tested 3.50% this week).
- It's worth watching copper price dynamics over the coming weeks. The correlation has not worked well since early 2021 but a sudden recoupling with Treasuries could imply that 10Y yields have gone too far and a major deceleration in activity is at hand.
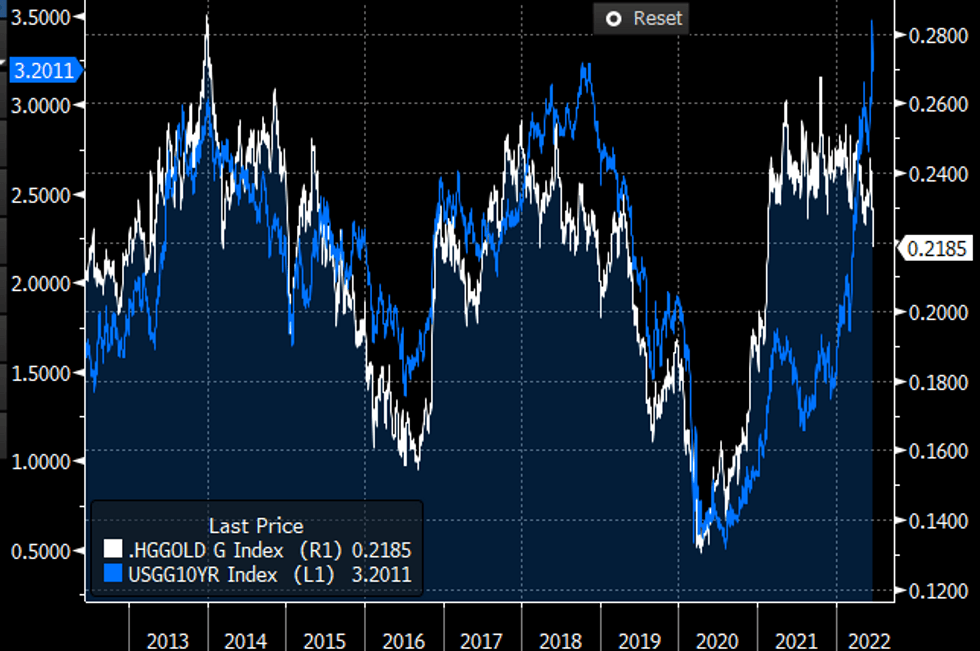 Source: BBG, MNI