BONDS: Japanese Home Bias Maintained On Steep JGB Curve, Vol. & FX-Hedge Costs
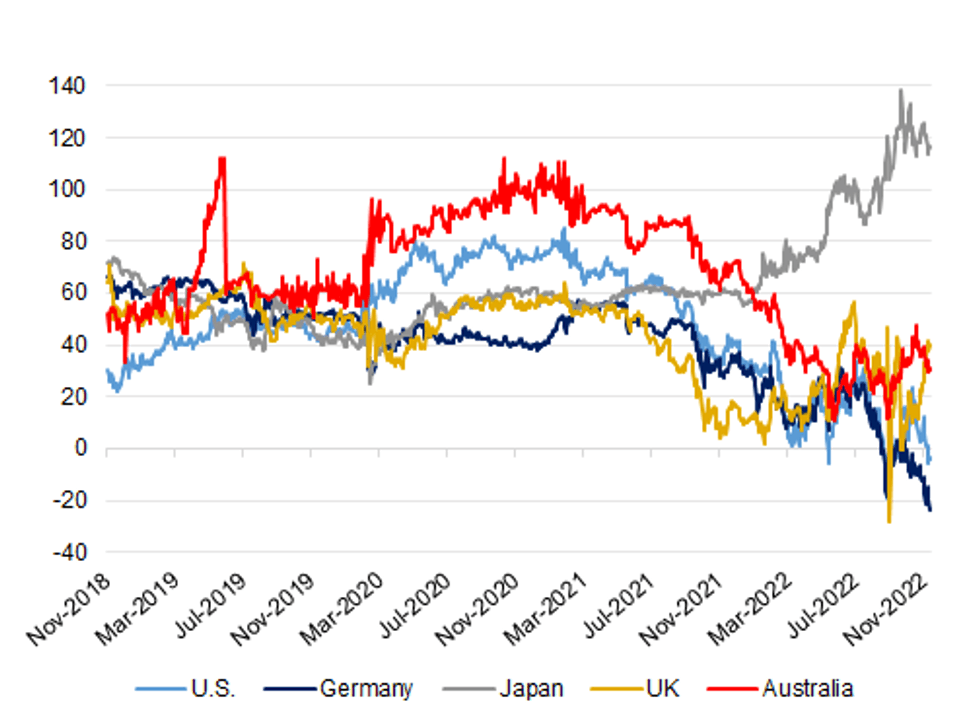
While it is a topic we have flagged on many occasions in recent months, it is worth remembering that the steepness of the 10-/30-Year JGB curve (albeit owing to the BoJ’s YCC policy, which some are speculating will be altered in ’23, although that is a topic for another time), alongside ongoing market vol. and elevated FX hedging costs, have facilitated a home bias for the Japanese life insurer and pension fund cohort.
- This has resulted in several rounds of record monthly net foreign bond sales on the part of Japanese insurers during ’22, most recently in November, when they recorded a net sale of ~Y1.93tn of offshore bonds (this represented the ninth consecutive month of net sales).
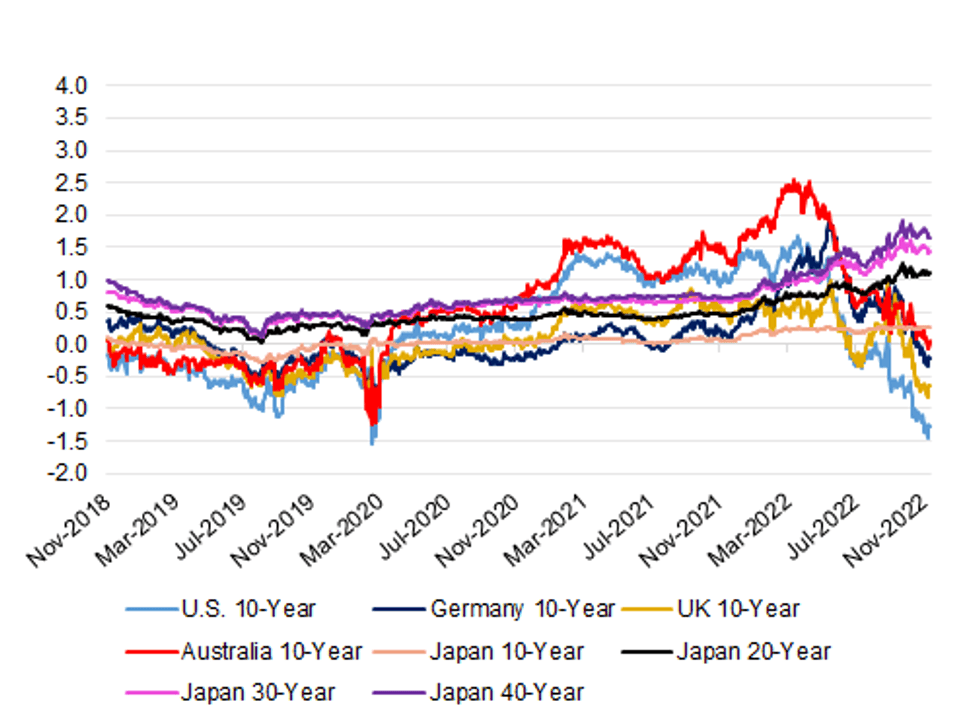
- The second figure highlights the yield pickup that 10- to 40-Year JGBs provides vs. the major 10-Year core global FI alternatives (adjusted for rolling 3-month FX hedging costs from the perspective of a Japanese investor).
- There will be a point whereby offshore paper becomes a little more attractive for this investor cohort, but we haven’t reached that point yet. This week’s central bank decisions are (of course) keenly awaited.
Fig. 1: 10-/30-Year JGB Yield Spread Vs. Major Global Counterparts (bp)
 Source: MNI - Market News/Bloomberg
Fig. 2: 10- To 40-Year JGB Yields Vs. The Major 10-Year Core Global FI Alternatives, FX-Hedged From The Perspective Of A Japanese Investor (%)
 Source: MNI - Market News/Bloomberg
Want to read more?
Find more articles and bullets on these widgets:
Historical bullets
USDCAD TECHS: Heading South
- RES 4: 1.3808 High Nov 3
- RES 3: 1.3763 Trendline resistance drawn from the Oct 13 high
- RES 2: 1.3571 High Nov 10
- RES 1: 1.3490 50-day EMA
- PRICE: 1.3266 @ 15:58 GMT Nov 11
- SUP 1: 1.3257 Low Nov 11
- SUP 2: 1.3205 61.8% retracement of the Aug 11 - Oct 13 rally
- SUP 3: 1.3139 Low Sep 14
- SUP 4: 1.3023 76.4% retracement of the Aug 11 - Oct 13 rally
USDCAD maintains a bearish theme and Thursday’s sell-off resulted in a new multi-month low. This tilts the balance further in favour of bears. A continuation lower signals scope for a test of 1.3205, a Fibonacci retracement. On the upside, key short-term resistance has been defined at 1.3571, Thursday’s high.
US TSYS: Tsys Weaker, But Near Highs, Dec Step-Down Still Alive
Still weaker, Tsys near top end of session (and overnight range, for that matter) amid two-way positioning ahead the weekend. Light volumes (TYZ2<650k) due to Veterans Day/bank holiday despite full session hours on screen.
- Tsys pared back a small portion of Thu's post-CPI rally, opening moderately lower Friday. Markets still digesting the Oct CPI data: An unexpectedly softer U.S. CPI report for October paints a rosier picture of moderating inflation than is likely the case, Atlanta Fed economist Brent Meyer told MNI.
- Roughly 60% of the CPI basket is still rising at rates above 5%, and alternative measures of underlying inflation remain "very elevated, reflecting broad-based price pressure," he said.
- Little react to preliminary November reading of consumer sentiment from the University of Michigan of 54.7 vs. 59.5 est. Rates and equities gradually pared losses (stocks posting gains in the second half) as participants square up ahead the weekend, slow start to next week.
- Fed Gov Waller kicks things off Sunday evening from Australia. PPI data on Tuesday. Tsy coupon supply starts Wednesday w/ $15B 20Y Bond, 10Y TIPS re-open on Thursday.
AUDUSD TECHS: Northbound
- RES 4: 0.6800 Round number resistance
- RES 3: 0.6768 61.8% retracement of the Aug 11 - Oct 13 downleg
- RES 2: 0.6705 High Sep 21
- RES 1: 0.6695 High Nov 11
- PRICE: 0.6638 @ 15:55 GMT Nov 11
- SUP 1: 0.6514/0.6387 50-day EMA / Low Nov 10
- SUP 2: 0.6272 Low Nov 3 and a key support
- SUP 3: 0.6210/6170 Low Oct 21 / 13 and the bear trigger
- SUP 4: 0.6133 1.382 proj of the Apr 5 - May 12 - Jun 3 price swing
AUDUSD extended gains into the Friday close, confirming the clear break of the 50-day EMA. This strengthens bullish conditions and signals scope for an extension of the bull cycle that started mid-October. Markets have also cleared 0.6682, the Jul 14 low and a previous breakout level. Further out, scope is seen for a climb towards 0.6768, a Fibonacci retracement level. Firm short-term support has been defined at 0.6387, Thursday’s low.


