US STOCKS: Viewpoint - How Much Of AI Content Is Theft ?
The safety of AI has been a big debate recently with the frontier labs telling us they need guardrai...
Want to read more?
Find more articles and bullets on these widgets:
Historical bullets
AUD: AUD/JPY - Moving Back Toward Top-End Of Range As Risk Remains Constructive
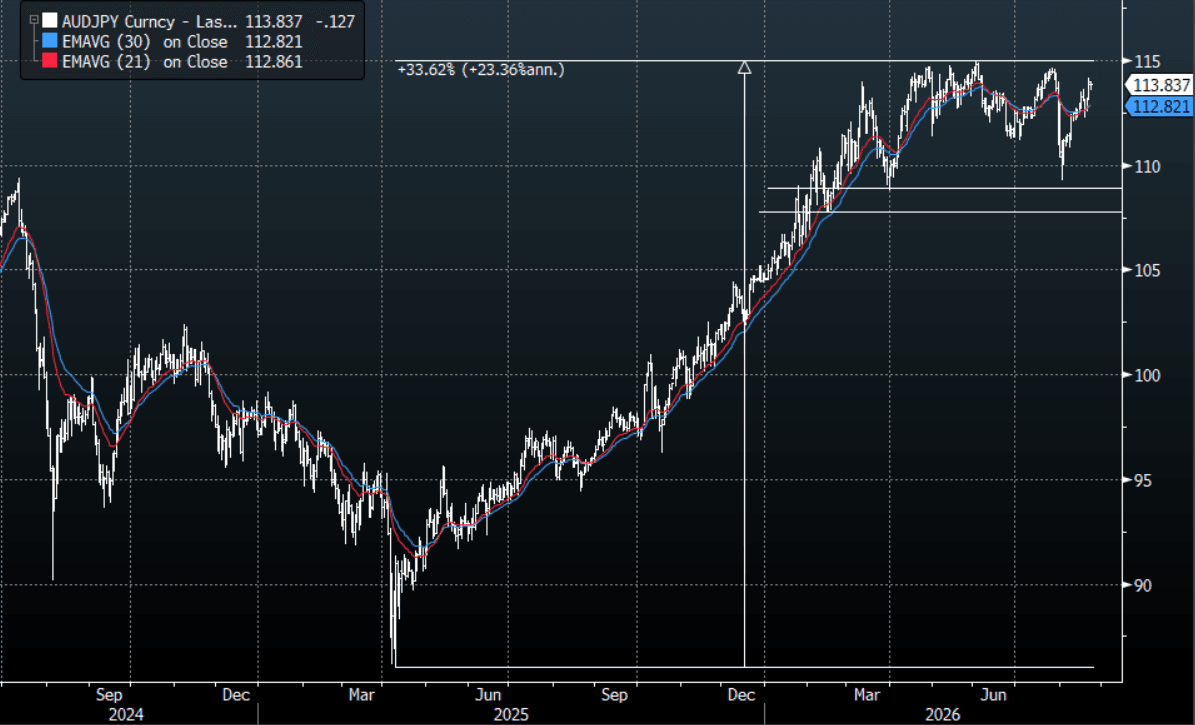
The AUD/JPY range Friday night was 113.44-114.16, Asia is currently trading around 113.80. The pair has moved back toward the top-end of its recent range after a strong bounce following the joint intervention. The pair has risen over 33% in just over a year so I err on the side of caution up here as price looks to be stalling for the first time and the easy money looks to potentially have been made. The market will now be wary of the MOF as well as the Fed in the short-term given that they have now added some significant two-way risk to the trade. This leaves the pair looking potentially a little stretched up here, though the appeal of the rate differential will most likely still keep the carry-trade alive should risk continue to trade on the front foot, which it currently continues to do. On the day, the first support is toward 112.85-113.15, it will need a sustained close back below 111.50-112.00 area for the momentum to turn lower again.
- The AUD/JPY Average True Range(ATR) for the last 10 Trading days: 73 Points
Fig 1: AUD/JPY spot Daily Chart
Source: MNI - Market News/Bloomberg Finance L.P
AUSTRALIA: RBA Minutes, July CPI & Consumption Highlights Of The Week
The focus of the week will be on Wednesday’s July CPI data but Tuesday’s RBA August minutes and Thursday’s July household spending will also receive significant attention.
- Wednesday's CPI trimmed mean is forecast to moderate 0.1pp to 3.5%. Domestically-driven services and non-tradeables have shown resilience and some moderation here will be welcome. Headline is expected to rise 0.9% m/m but moderate to 3.3% from 3.8% in July. The 5.3% rise in retail petrol prices in July is likely to boost the CPI transport component.
- While the RBA left rates unchanged at 4.35% this month, Governor Bullock sounded hawkish at the press conference. She said that if inflation doesn’t moderate as expected, then the Board will hike again. The meeting minutes published on Tuesday will be scrutinised for details of the bank’s thinking on upside inflation risks.
- Also on Tuesday, RBA’s Jacobs speaks on liquidity at 1400 AEST.
- July household spending is released on Thursday and expected to rise 0.3% m/m & 5.7% y/y after a robust June outcome which was supported by strong discretionary spending.
- This week sees the first Q2 GDP components with construction on Tuesday and capex Thursday. Bloomberg consensus expects them to rise 0.4% q/q after Q1’s 3.4% and 0.8% q/q after 6.5% respectively. GDP prints on 2 September.
- Westpac’s leading index for July is released on Wednesday. It has been showing growth moderately below trend going into 2027.
US STOCKS: S&P - Drifts Back Toward 7700 As Pullback Wanes
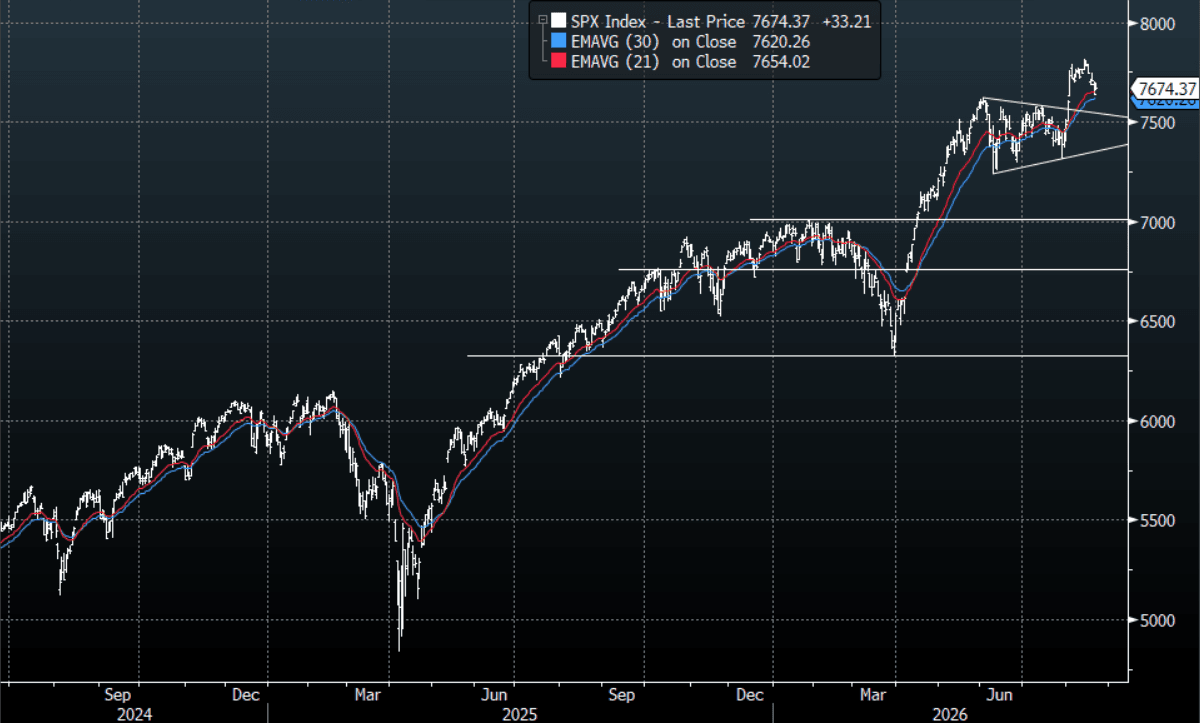
The S&P(ESU6) range Friday night was 7667.25 - 7714.00, SPX closed +0.43%, Asia is currently trading around 7692. The market could not extend lower to end last week and gravitated back toward the 7700 area. It feels like the market is a little lost for conviction at the moment, some important potential triggers coming up this week though with US GDP & PCE, Nvidia earnings and then Jackson Hole just to round the week off. While the S&P(SPX) holds above 7250-7300 the bulls still remain in control though last week's price action seems to indicate this reversion back to the mean could potentially have more to play out. On the day, while the 7700-7750 area continues to cap in the short-term I will be watching to see if the ESU6 contract can move back toward the 7500-7600 support. I suspect we could see buyers return down there at the first time of asking.
- Robin Brooks on X - “Deficits and debt issuance are running far above pre-COVID levels across the G10. Increasingly, issuance is happening at the shorter end of the yield curve, which is what happens when countries run out of fiscal space. The global debt crisis is building…”
- Barry R McCaffrey on X: “In my judgement, the US Armed Forces have probably permanently lost access to 15 Persian Gulf bases. Iran now poised to control access the Gulf States. The US will have to negotiate new access in western Saudi Arabia, Israel, southern Europe.”
- The Market Ear X: “What if the biggest risk to the AI trade isn’t valuations, rates or capex — but the midterms?”
- Bloomberg US INSIGHT: “The Real Signals From Bessent’s Buyback Operation.” https://blinks.bloomberg.com/news/stories/TK4CROKK3NY8
- The S&P 500 Index Average True Range(ATR) for the last 10 Trading days: 58 Points
Fig 1: S&P 500(SPX) Index Daily Chart
Source: MNI - Market News/Bloomberg Finance L.P


