FOREX: USD Index Reverses Steadily Higher, GBP Backtracks
Jul-16 17:16
* Despite the USD index posting a daily close below its 20-day EMA for the first time since mid-Ma...
Want to read more?
Find more articles and bullets on these widgets:
Historical bullets
US DATA: GDPNow Marked Down To Softest Of Q2 Vintage
Jun-16 17:11
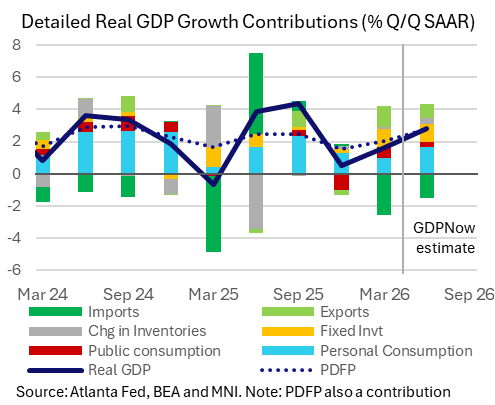
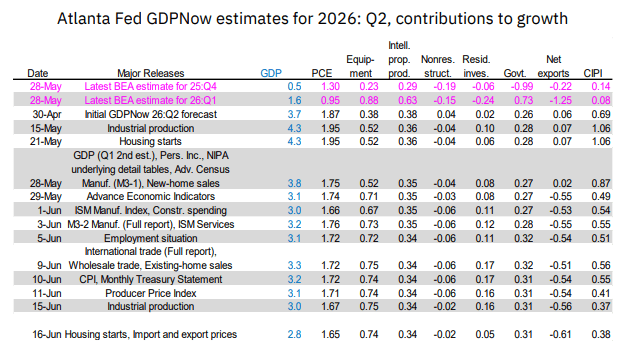
The Atlanta Fed’s GDPNow for real GDP growth in Q2 has been revised from 3.3% to 2.8% annualized since its last update a week ago, driven by various releases but with the largest single step from soft housing starts. PDFP is still seen accelerating to a solid 3.1-3.2% in Q2 however, which if accurate would be its strongest quarter since 3Q24.
- GDPNow has seen a reasonable trimming in Q2 real GDP tracking to 2.83% annualized from 3.29% in its last update from Jun 9, marking a new low for Q2 tracking.
- Details suggests a steady drip feed of negative revisions from various releases over that time although with the largest step coming from today’s weak housing starts release (from 3.0% to 2.8%).
- It would still mark an acceleration from the 1.6% in Q1 and 0.5% in Q4 as real GDP growth continues to have seen sizeable swings after a particularly volatile 2025 (averaging 2.0% but with a range of -0.65% in 1Q25 to 4.4% in 3Q25).
- Private domestic final purchases (PDFP) continues to give a better sense of underlying demand in the economy and is currently seen increasing circa 3.1-3.2% vs 3.3% prior to last week’s update. That would be an acceleration from the 2.4% in Q1 and also averaged through 2025.
- As for some key drivers since the last update, PCE is seen increasing 2.4% vs 2.5% prior (1.4% in Q1) whilst equipment investment is still seen jumping another 13.8% vs 14.0% prior (17.2% in Q1). The hit unsurprisingly comes from residential investment now seen rising just 1.3% annualized vs 4.3% prior for a tepid bounce after the -6.3% in Q1.
- Latest expected contributions: PDFP seen adding 2.8pp after 2.1pp in Q1 (of which overall non-resi invt seen at 1.1pp after 1.35pp and PCE at 1.65pp after 0.95pp), government 0.3pp after 0.7pp, changes in inventories 0.4pp vs 0.1pp and net exports -0.6pp vs -1.25pp.
US TSYS/SUPPLY: 20Y Bond Auction Review: Solid Peripheral Stats On Trade-Through
Jun-16 17:08
June's 20Y Bond auction was solid, with the 4.927% high yield representing a 1.0bp trade-through vs the 4.937% when-issued yield at cutoff.
- That was the biggest trade-through since January and means the 20Y has avoided a tail for the 6th auction in the last 7.
- Peripheral stats were solid as well, with a bid-to-cover of 2.75x the highest since March (2.64x 5-auction average), primary dealer takeup just 8.5% (10.4% 5-auction average), lowest since January; directs taking 19.9% (24.7% 5-auction average) and indirects 71.6% (64.8% 5-auction average), highest since July 2024.
- Treasury futures ticked up very briefly on the result but are back at pre-auction levels.
FED: US TSY 19Y-11M BOND AUCTION: HIGH YLD 4.927%; ALLOT 56.57%
Jun-16 17:02
- US TSY 19Y-11M BOND AUCTION: HIGH YLD 4.927%; ALLOT 56.57%
- US TSY 19Y-11M BOND AUCTION: DEALERS TAKE 8.48% OF COMPETITIVES
- US TSY 19Y-11M BOND AUCTION: DIRECTS TAKE 19.94% OF COMPETITIVES
- US TSY 19Y-11M BOND AUCTION: INDIRECTS TAKE 71.57% OF COMPETITIVES
- US TSY 19Y-11M BOND AUCTION: BID/COV 2.75


