OPTIONS: US Options Roundup - 14 Aug 2026
Friday's U.S. rates/bond options flow included: * SFRQ6 98.18c, traded 3.25 in 3k. * SFRQ6 96.06/96...
Want to read more?
Find more articles and bullets on these widgets:
Historical bullets
US INFLATION: MNI US Inflation Insight: First Half Ends With Notable Cooling
We've just published our US Inflation Insight - Download Full Report Here
- June’s inflation data was substantially softer than expected, providing a modicum of relief after a string of hot reports.
- The CPI report saw almost all major categories come in below expectations, with headline of -0.42% M/M below the -0.2% expected and the lowest since April 2020 as the Y/Y rate fell to a 3-month low 3.53% from 4.25% prior.
- Energy was as expected the main driver of downside to headline CPI, at -5.7% M/M, with food also largely in line at +0.2%.
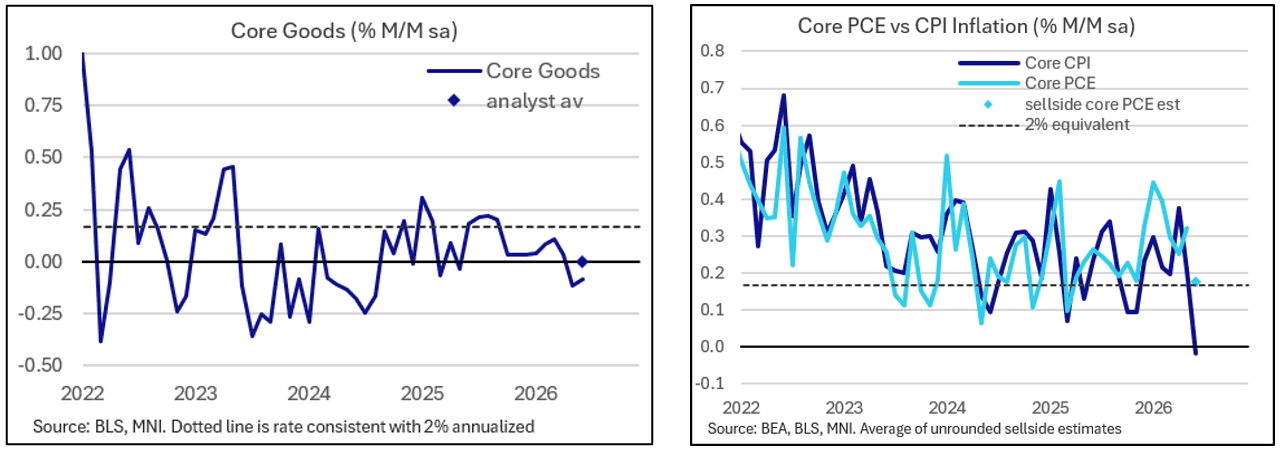
- Meanwhile, core had its first negative print since May 2020 (-0.02% M/M) with Y/Y down to a 4-month low 2.59% from 2.85% prior.
- The surprise swing into sequential deflation in core CPI was driven by a surprisingly sharp pullback in core services inflation, which saw its joint-lowest print (0.03% M/M) since May 2020. Supercore was also surprisingly negative, helped by a drop in lodging prices among other factors.
- Core goods CPI was soft by almost any measure in June, coming in line at -0.09% vs MNI median 0.0% and -0.11% in May. Bigger picture: core goods prices have barely risen in 2026 so far (up 0.06%) and have risen an average 0.07% M/M over the last 12 months, despite the expected upside impact from tariffs and the latest energy price shock.
- Additionally, MNI’s measures of inflation breadth showed further cooling.
- June's PPI report echoed CPI in showing an unexpectedly sharp slowdown in sequential pressures vs May. Pipeline inflation remains elevated but is showing signs of having peaked.
- Headline final demand PPI came in at -0.3% M/M vs 0.0% expected and came with a large downward revision to May (0.6% vs originally-reported 1.1%), as ex-food/energy/trade services printed a 6-month low 0.1% M/M after a 50-month high 0.8% prior.
- Analysts now eye core PCE of between 0.17-0.19% M/M for the month with a median in our 5-analyst sample of 0.175%, below the 0.18% M/M prior to PPI and well down from vs 0.27% M/M before CPI.
- It’s only one month, as Chair Warsh reminded us following the CPI release ("There might be some that look at this morning's data and say, 'Oh, mission accomplished. Everything is swell. That is not my view.") and substantially more evidence will be required for the FOMC to back off its recent hawkish shift.
- Nonetheless Fed hike expectations progressively faded first through the data releases, with futures now implying 38bp of hikes through the June 2027 FOMC, versus 52bp prior to this inflation round.
- The more immediate implication was to all but price out a July hike, which looked like a 50/50 proposition following Gov Waller’s hawkish comments Monday but which now is seen with under 20% probability.
JGB TECHS: (U6) Approaching Resistance
- RES 3: 133.32 - High Mar ‘26
- RES 2: 130.66 - Low Jan 21
- RES 1: 128.19/42- 50-dma (cont) / High Jun 15
- PRICE: 128.12 @ 20:25 BST Jul 15
- SUP 1: 126.27 - Low May 20
- SUP 2: 125.70 - Low Feb 1999
- SUP 3: 121.49 - 50.0% retrace of the 1990 - 2020 major bull leg
A bearish theme in JGB futures remains intact despite the latest strong recovery. A resumption of weakness would expose 126.27, the May 20 low, where a break would confirm a continuation of the primary downtrend. Key near-term resistance has been defined at 128.42, the Jun 15 high. Clearance of this hurdle would instead signal a possible short-term reversal and highlight a potential break of the 50-dma - at 128.19.
AUDUSD TECHS: Corrective Cycle
- RES 4: 0.120 61.8% retracement of the May 6 - Jun 30 bear leg RES 3: 0.7088 High Jun 15
- RES 2: 0.7071 50.0% retracement of the May 6 - Jun 30 bear leg
- RES 1: 0.7021 Intraday high
- PRICE: 0.7006 @ 20:34 BST Jul 15
- SUP 1: 0.6960 20-day EMA
- SUP 2: 0.6907 Low Jul 8
- SUP 3: 0.6865 Low Jun 30 and the bear trigger
- SUP 4: 0.6757 38.2% retracement of the Apr 9 ‘25 - May 6 bull cyle
A bear cycle in AUDUSD remains intact and - for now - recent gains are considered corrective. However, Wednesday's gains resulted in a print above resistance at the 50-day EMA, at 0.7014. A clear break of the average would highlight a stronger short-term bounce and signal scope for a continued retracement of the May 6 - Jun 30 bear leg. Key support and the bear trigger lies at 0.6865, the Jun 30 low. A break would resume the downtrend.


