ASIA STOCKS: US China Restrictions; Post Nvidia Relief; BI Decision Later
Chinese equities were down across all major indices as escalating US-China semiconductor tensions fo...
Want to read more?
Find more articles and bullets on these widgets:
Historical bullets
EURUSD TECHS: Recent Recovery Appears Corrective
- RES 4: 1.1396 50-day EMA
- RES 3: 1.1337 High Oct 1
- RES 2: 1.1285 20-day EMA
- RES 1: 1.1269 High Oct 16
- PRICE: 1.1229 @ 06:06 BST Oct 19
- SUP 1: 1.1113/11 Low Oct 14 / 50.0% of Feb 3 ‘25 - Jan 27 bull leg
- SUP 2: 1.1063 1.236 proj of the Apr 17 - Jun 24 - Aug 20 price swing
- SUP 3: 1.0987 1.382 proj of the Apr 17 - Jun 24 - Aug 20 price swing
- SUP 4: 1.0882 61.8% retracement of the Feb 3 ‘25 - Jan 27 bull leg
EURUSD trend conditions are unchanged, they remain bearish and a fresh cycle low last week reinforces the bear theme. The pair has recovered from its latest low print, however, gains are considered corrective - for now. Recent weakness confirms a resumption of the downleg that started on Aug 20. Scope is seen for a move towards 1.1111, a Fibonacci retracement point. Initial firm resistance to watch is 1.1285, the 20-day EMA.
BUND TECHS: (Z6) Monitoring Resistance
- RES 4: 123.13 1.000 proj of the Sep 28 - Oct 2 - 8 price swing
- RES 3: 123.00 Round number resistance
- RES 2: 122.47 0.764 proj of the Sep 28 - Oct 2 - 8 price swing
- RES 1: 122.14 High Oct 16
- PRICE: 121.63 @ 05:47 BST Oct 19
- SUP 1: 120.35/119.19 Low Oct 8 / Low Sep 28 and the bear trigger
- SUP 2: 119.00 Round number support
- SUP 3: 118.87 3.236 proj of the Aug 13 - 20 - 25 price swing
- SUP 4: 118.65 3.382 proj of the Aug 13 - 20 - 25 price swing
Bund futures continue to trade closer to their recent highs. Last week’s move higher resulted in a breach of resistance at the 50-day EMA, at 121.61. A second important resistance at 121.97, the Oct 2 high, has been pierced. A clear breach of both price points would undermine the bear theme, and signal scope for a stronger recovery. This would open 122.47, a Fibonacci projection. Initial key support to watch is 120.35, the Sep 28 low.
ASIA STOCKS: MSCI Headwinds; Tech Valuation Concerns; KOSPI Calm;
The Jakarta Composite is down over 5% and near a six-year low. Index provider MSCI's warning that it is consulting on a proposal to downgrade Indonesia from an "Emerging Market" to a "Standalone Market" status would completely remove Indonesian equities from major global benchmarks, triggering massive automated capital flight. Over the weekend, the OJK Chairperson convened an emergency meeting at IDX alongside market participants. The OJK has officially pledged to accelerate capital market reforms—including tougher free-float compliance and tighter disclosure rules—to prove to MSCI that it is actively cleaning up domestic market manipulation.
Elsewhere markets are somewhat calmer with mixed fortunes across the region. The NIKKEI is down -0.60% as a sell-off in U.S. tech carried directly into the Asian session. Investors are growing increasingly anxious over a potential financing crunch and whether the Capex required to build AI infrastructure will yield justifiable near-term returns. Major index heavyweights and chip-related stocks bore the brunt of the damage, with SoftBank Group plunging over -3% and Tokyo Electron sliding over -2%
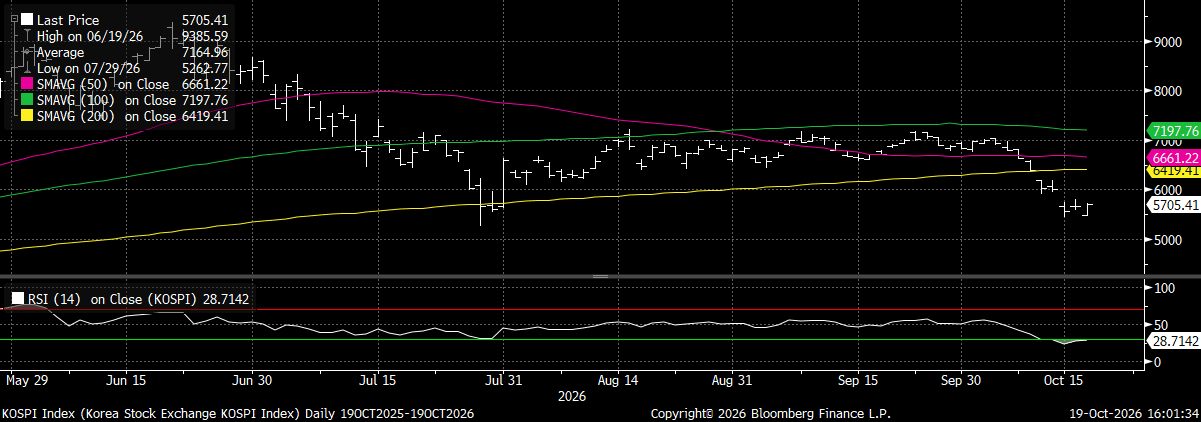
After last week's massive declines, there was calm on the KOSPI with gains of +0.67% - with gains looking largely technically driven. The sell off last week took the index into oversold territory and the gains today see it trying to back away from that.
Chinese bourses are mixed with the Hang Seng closed, the CSI 300 and Shanghai have posted modest gains whilst the tech overhang sees Shenzhen lower by -0.40%. On an individual security level, the biggest decliners in mainland markets included several major electronic and manufacturing caps listed in Shenzhen with Zhongji Innolight down -1.5% whilst Shenzhen Zesum Technology - the technology infrastructure firm - is down -2.50%
Fig 1: KOSPI Remains Oversold on 14-day Relative Strength Index
source: Bloomberg FInance LP / MNI


