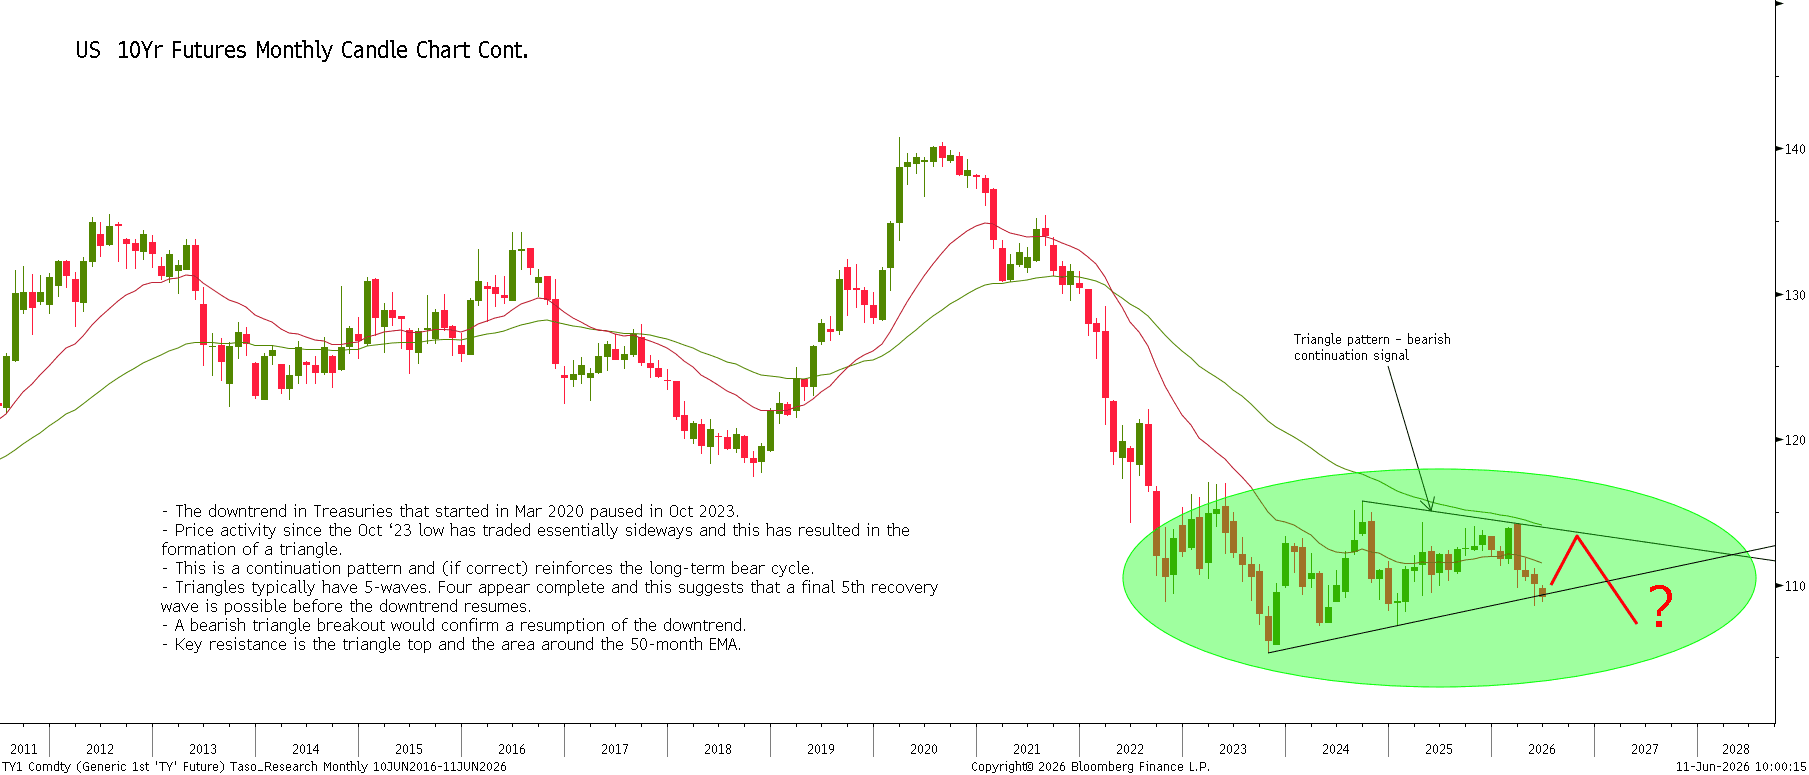
Triangle Pattern In Treasuries Reinforces A M/T Bearish Theme

Jun-11 10:10By: Taso Anastasiou
- The downtrend in Treasuries that started in Mar 2020 paused in Oct 2023.
- Price activity since the Oct ‘23 low has traded essentially sideways and this has resulted in the formation of a triangle.
- This is a continuation pattern and (if correct) reinforces the long-term bear cycle.
- Triangles typically have 5-waves. Four appear complete and this suggests that a final 5th recovery wave is possible before the downtrend resumes.
- A bearish triangle breakout would confirm a resumption of the downtrend.
- Key resistance is the triangle top and the area around the 50-month EMA.