EM ASIA CREDIT: Tata Steel (TATAIN): 2QFY27 Results
Results out on Saturday. "*TATA STEEL 2Q REV. 654.36B RUPEES, EST. 641.52B RUPEES" - BBG "*TATA STE...
Want to read more?
Find more articles and bullets on these widgets:
Historical bullets
US PREVIEW: The US Macro Week Ahead: Warsh At The IMF, September Inflation
The September inflation round will be the data focus in the coming week, with CPI Wednesday, PPI Thursday, and Import/Export prices Friday.
- MNI's early unrounded analyst consensus for September's core CPI print is 0.22% M/M in a range of 0.19-0.24%, with headline at 0.58%. A headline figure in line with consensus would be one of the three highest monthly prints since 2022 (0.40% Aug), and would largely reflect resurgent energy prices (gasoline expected up roughly 9% M/M SA, with overall energy up a little over 5%) in bringing Y/Y to 3.6-3.7% (3.4% prior). August’s above-expected 0.29% core reading was largely driven by an idiosyncratic jump in communications services prices, and that category is expected to have retreated sharply last month in turn helping cool supercore substantially from August’s 0.51%.
- While September PPI is expected to be elevated if relatively steady on aggregate (0.5% M/M after 0.4%, with core ex-food/energy/trade 0.4% after 0.3%), the details are expected to be relatively neutral in terms of core PCE implications: estimates we’ve seen are basically in line with the core CPI, at 0.22% M/M (0.25% prior). In turn that would keep the Y/Y core PCE gauge at around 3.0% and the 6-month annualized rate at 2.7% for another month, which while still well above the Fed’s 2% headline target would maintain expectations for an October rate hold.
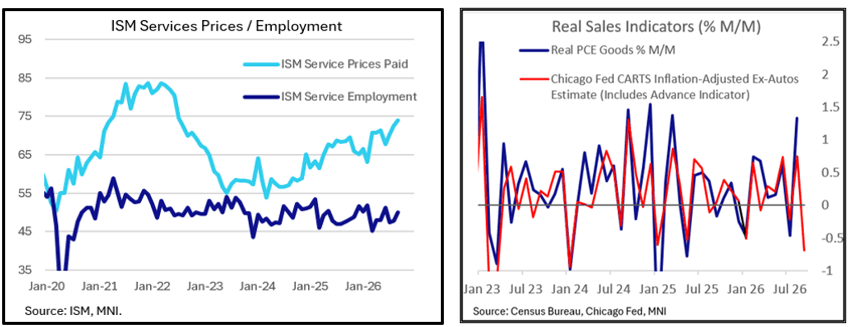
- Retail sales Thursday will offer a status check on consumer dynamics amid the continued rise in gas prices. The Chicago Fed's Advance Retail Trade Summary (CARTS) estimates that retail sales ex-autos rose 0.4% M/M in September on a preliminary basis, exactly in line with current consensus for the Census Bureau advance ex-autos retail sales of 0.4% M/M (consensus also sees 0.3% Control Group, with 0.3% M/M overall), though overall if correct it implies a big slowdown in core goods consumption momentum after August strength, particularly on an inflation-adjusted basis.
- In terms of Fedspeak, while we get the Beige Book Wednesday, focus will be on Chair Warsh who will participate in a Fireside chat with IMF Managing Director Georgieva on Thursday at 2330EST at the IMF annual meetings in Thailand.
- Coming just before the FOMC's pre-meeting blackout period begins, it's a final opportunity for the Chair to steer expectations for the October 28 decision. But it's very likely he will avoid any overt forward guidance as usual (and markets have already taken heed of other senior Fed officials' lack of urgency over a hike), leaving attention on how he characterizes the latest inflation data released prior to his appearance and the monetary policy consequences of the run-up in bond yields since the September FOMC.
| Date | ET | Impact | Event |
| 12-Oct | 1250 | Cleveland Fed's Beth Hammack | |
| 13-Oct | 345 | Fed's Waller | |
| 13-Oct | 600 | ** | NFIB Small Business Optimism Index |
| 13-Oct | 855 | ** | Redbook Retail Sales Index |
| 13-Oct | 1000 | *** | NAR existing home sales |
| 13-Oct | 1300 | Richmond Fed's Tom Barkin | |
| 13-Oct | 1400 | ** | Treasury Budget |
| 13-Oct | 1600 | Boston Fed's Susan Collins | |
| 14-Oct | 700 | ** | MBA Weekly Applications Index |
| 14-Oct | 830 | *** | CPI |
| 14-Oct | 1330 | Richmond Fed's Tom Barkin | |
| 14-Oct | 1400 | Fed Beige Book | |
| 15-Oct | 830 | *** | Retail Sales |
| 15-Oct | 830 | *** | Jobless Claims |
| 15-Oct | 830 | *** | PPI |
| 15-Oct | 830 | ** | Empire State Manufacturing Survey |
| 15-Oct | 830 | ** | Philadelphia Fed Manufacturing Index |
| 15-Oct | 830 | *** | PPI |
| 15-Oct | 1000 | * | Business Inventories & Sales |
| 15-Oct | 1630 | Cleveland Fed's Beth Hammack | |
| 15-Oct | 2330 | Fed Chair Warsh | |
| 16-Oct | 830 | ** | Import/Export Price Index |
| 16-Oct | 830 | ** | NY Fed Services |
| 16-Oct | 915 | *** | Industrial Production |
| 16-Oct | 1600 | ** | Net TICS Flows |
STIR: Quarterly Rate Cadence Intact Heading Into Inflation Week
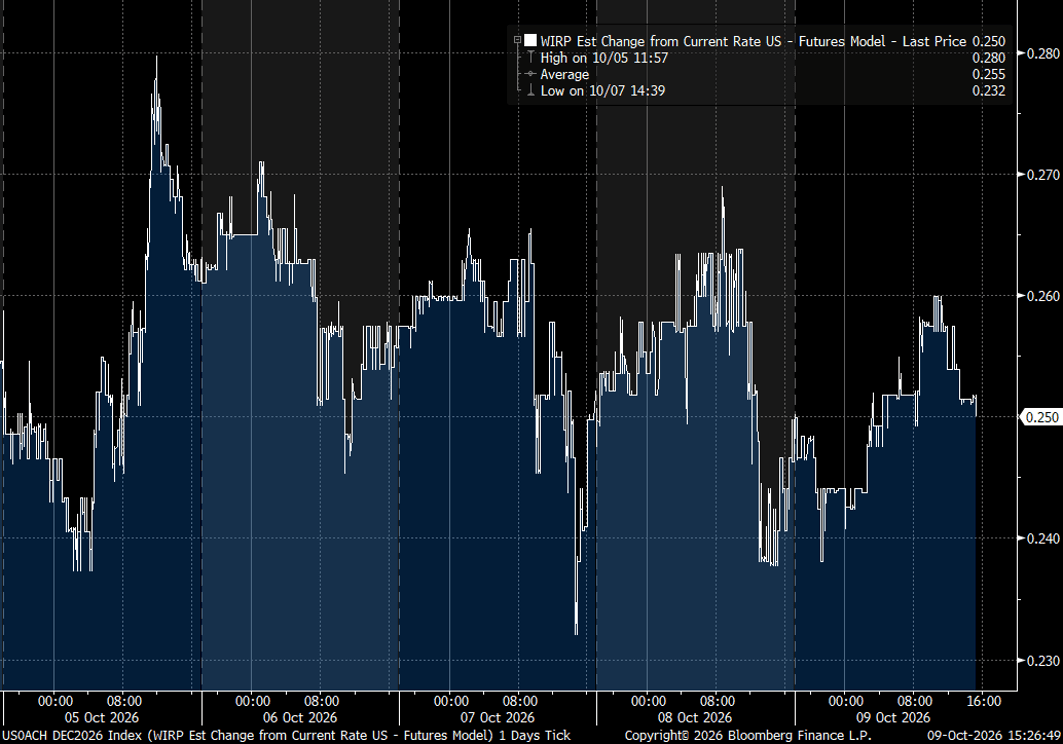
The implied Fed rate hike path tilted slightly lower this week, with around 5bp of expected tightening removed over the next 12 months. October hike expectations haven’t recovered from last week’s salvo of non-urgency from Fed’s Jefferson, Williams, and Bowman, nor the softer-than-expected August PCE print.
- But 25bp is still just about fully priced through end-2026, with Gov Waller’s relatively hawkish-leaning comments this week keeping a 25bp quarterly pace of tightening intact though mid-next year.
- That looks like: 52bp Mar 2027, 72bp Jun 2027, 80bp Sep 2027, peak of 81bp Oct 2027.
Meeting | Current FF Implieds (%), LH | Cumulative Change From Current Rate (bp) | Incremental Chg (bp) | End of Last Week (Oct 02) | Chg Since Then (bp) |
Oct 28 2026 | 3.93 | 4.8 | 7.1 | 3.93 | -0.5 |
Dec 09 2026 | 4.13 | 24.9 | 20.1 | 4.13 | -0.1 |
Jan 27 2027 | 4.23 | 34.7 | 9.8 | 4.23 | -0.3 |
Mar 17 2027 | 4.41 | 52.6 | 17.9 | 4.42 | -1.0 |
Apr 28 2027 | 4.50 | 61.7 | 9.1 | 4.52 | -2.1 |
Jun 09 2027 | 4.60 | 72.4 | 10.7 | 4.63 | -2.7 |
Jul 28 2027 | 4.64 | 76.2 | 3.8 | 4.68 | -3.8 |
Sep 15 2027 | 4.68 | 80.3 | 4.1 | 4.73 | -4.5 |
Oct 27 2027 | 4.69 | 81.0 | 0.7 | 4.74 | -4.8 |
Dec 08 2027 | 4.69 | 80.6 | -0.4 | 4.72 | -3.8 |
MACRO ANALYSIS: MNI US Macro Weekly: Quarterly Hikes Stay In Play Ahead Of CPI
We've just published our US Macro Weekly - Download Full Report Here
- The implied Fed rate hike path tilted slightly lower in a data-light week, with around 5bp of expected tightening removed over the next 12 months.
- September's ISM Services index saw a slight dip as expected, to 54.9 (55.0 consensus) from August's 55.4, with softer activity details, stronger employment, and markedly higher price pressures amid apparent supply chain constraints and soaring energy prices.
- Inflation expectation components within the NY Fed's consumer survey continued their uptrend with the 1Y at its highest since 2023, with the UMichigan prelim October survey showing a slight uptick too.
- Higher frequency labor indicators were robust: weekly ADP increased at its fastest pace since mid-June whilst the four-week average of initial jobless claims hit a fresh low in over fifty years.
- MBA 30Y mortgage rates unsurprisingly saw another 19bp large increase last week, with mortgage rates now 70bp higher since late August during which time composite applications has dropped 17%. They’re at fresh highs since Nov 2023.
- Governor Waller's first post-September FOMC remarks had some notable hawkish leanings: he anticipates additional hikes (plural). His comment that hikes don't need to come at consecutive meetings but also that "they should be in place in an acceptable period of time" broadly chimed with prior market pricing which was close to fully pricing 25bp hikes at Dec, Mar and Jun SEP meetings.
- SF Fed’s Daly (’27 voter) also offered some relatively more hawkish rhetoric compared to previous views, primarily regarding lingering shocks from a variety of sources, although she does still "have some probability" that rates can stay on hold from here.