USDCAD TECHS: Slips Sharply on USD Downdraft
- RES 4: 1.4111 Apr 10
- RES 3: 1.4019 38.2% retracement of the Feb 3 - Jun 16 bear leg
- RES 2: 1.3920 High May 21
- RES 1: 1.3879 High Aug 1
- PRICE: 1.3794 @ 17:42 BST Aug 1
- SUP 1: 1.3716/3557 20-day EMA / Low Jul 03
- SUP 2: 1.3540 Low Jun 16 and the bear trigger
- SUP 3: 1.3503 1.618 proj of the Feb 3 - 14 - Mar 4 price swing
- SUP 4: 1.3473 Low Oct 2 2024
A short-term bullish corrective phase in USDCAD remains in play despite sharp weakness Friday. On the recent run higher, price traded through the 50-day EMA at 1.3739 and this has been followed by a break of resistance at 1.3798, the Jun 23 high. Clearance of 1.3798 represents an important short-term bullish development, signalling scope for a stronger recovery. Sights are on 1.3920 next, the May 21 high. On the downside, initial firm support to watch lies at 1.3716, the 20-day EMA.
Want to read more?
Find more articles and bullets on these widgets:
Historical bullets
USDCAD TECHS: Trend Needle Points South
- RES 4: 1.4111 High Apr 4
- RES 3: 1.4016 High May 12 and 13 and a key resistance
- RES 2: 1.3920 High May 21
- RES 1: 1.3792 50-day EMA
- PRICE: 1.3631 @ 16:29 BST Jul 2
- SUP 1: 1.3591 Low Jun 30
- SUP 2: 1.3540 Low Jun 16 and the bear trigger
- SUP 3: 1.3503 1.618 proj of the Feb 3 - 14 - Mar 4 price swing
- SUP 4: 1.3473 Low Oct 2 2024
A downtrend in USDCAD remains intact and short-term gains between Jun 16 - 23 appear to have been corrective. Key support and the bear trigger has been defined at 1.3540, the Jun 16 low. Clearance of this price point would resume the downtrend and open 1.3503, a Fibonacci projection. Pivot resistance to monitor is at the 50-day EMA, at 1.3792. A clear break of this average would signal scope for a stronger recovery.
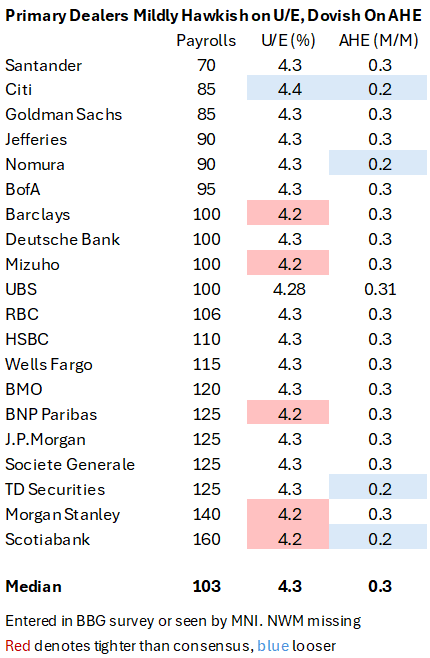
US OUTLOOK/OPINION: AHE Expected To Continue Slow Y/Y Moderation In June
- Average hourly earnings (AHE) growth is expected to be return to a more typical 0.3% M/M in June after a surprisingly strong 0.42% M/M in May (when consensus had also been for 0.3%).
- It has averaged 0.32% M/M in both the past three and past twelve months but has regularly oscillated within a 0.2-0.4% M/M range.
- Primary dealer analysts see a mild dovish skew, with four looking for 0.2% M/M [table below]. The Y/Y is seen edging a tenth lower to 3.8% Y/Y after three months between 3.86-3.89% Y/Y. The three months to May have also been tracking at 3.8% annualized for an acceleration from a softer 3.3% in the prior three months to February.
- Wage growth more broadly has surprised to the upside so far this year, with a notably strong unit labor cost increase of 6.6% annualized in Q1 offering a warning shot even if the admittedly noisy series is still only up 1.9% Y/Y when looking at slower moving trends. Indeed, as Fed Chair Powell again noted on the June FOMC press conference: “the labor market is not a source of significant inflationary pressures”.
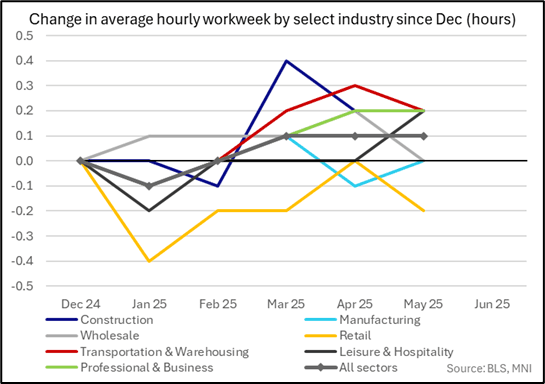
- Linked to the AHE figure, at least for those in salaried employment, average weekly hours worked are expected to hold at 34.3 for what would be a fourth consecutive month.
- As we regularly note, downside surprises here should carry some dovish weight, starting from an already low base compared to a pre-pandemic range primarily at 34.4-34.5 with a few 34.3 and 34.6 readings. January’s 34.1 was particularly low although is likely linked to unusually adverse weather, but there have been a few 34.2 readings over the past year or so.
AUDUSD TECHS: Northbound
- RES 4: 0.6700 76.4% retracement of the Sep 30 ‘24 - Apr 9 bear leg
- RES 3: 0.6688 High Nov 7 ‘24
- RES 2: 0.6603 High Nov 11 ‘24
- RES 1: 0.6590 High Jul 01
- PRICE: 0.6570 @ 16:24 BST Jul 02
- SUP 1: 0.6508 20-day EMA
- SUP 2: 0.6459/6373 50-day EMA / Low Jun 23 and a reversal trigger
- SUP 3: 0.6357 Low May 12
- SUP 4: 0.6275 Low Apr 14
The medium-term trend set-up in AUDUSD is unchanged, it remains bullish and this week’s gains strengthen current conditions. The break higher marks a resumption of the uptrend and maintains the bullish price sequence of higher highs and higher lows. Sights are on 0.6603 next, the Nov 11 2024 high. Key short-term support has been defined at 0.6373, the Jun 23 low. A pullback would be considered corrective.