ASIA STOCKS: SK Hynix Results; JN Results Later; BOJ; China Bounce
Following on from the Anthropic induced rally yesterday, SK Hynix report its 2026 results that beat ...
Want to read more?
Find more articles and bullets on these widgets:
Historical bullets
JGBS: Still Eyeing 124.00 Downside Test, Cash JGB Yields Up, Front End Leads
JGB futures sit at 124.20, -.15 versus settlement levels in latest dealings. Earlier cycle lows were at 124.05, with 124.00 a downside target, followed by 123.6 (a technical target). We are oversold per RSI (14), but firm downtrend risks persist. Sep 18 highs were 125.49 in terms of upside resistance. The regional/UST futures skew is lower on the back of higher oil futures amid the on-going US-Iran impasse over Hormuz. Cash UST yields are rebounding (+2-5bps led by the front end).
- Cash JGB yields are higher, but led by the front end as well. The 2y is closing in on a 2% upside test, last near 1.98% (up close to 4.5bps so far today). 10-40yr tenors are up around 2bps at this stage, leaving curves with a modest flattening bias. The 2/30s were last +113bps, against recent highs of +117bps.
- We had the BoJ minutes out from the July policy meeting out earlier. These are quite dated now, but show a clear bias to tighten further, amidst still easy financial conditions and rising confidence in the achieving the 2% inflation target. Uncertainty remained though around the pace of tightening.
- The PPI services print for Aug rose 3.7%y/y, slightly above the 3.6% forecast. This takes the y/y rise back to 2024 highs. On Thursday, the Q3 Tankan is out, then on Friday the Tokyo CPI for Sep.
- On the supply front, tomorrow's 40yr debt sale will be the main focus point this week.
GOLD: Momentum Turning Lower, Potentially Targeting The Bottom Of Range
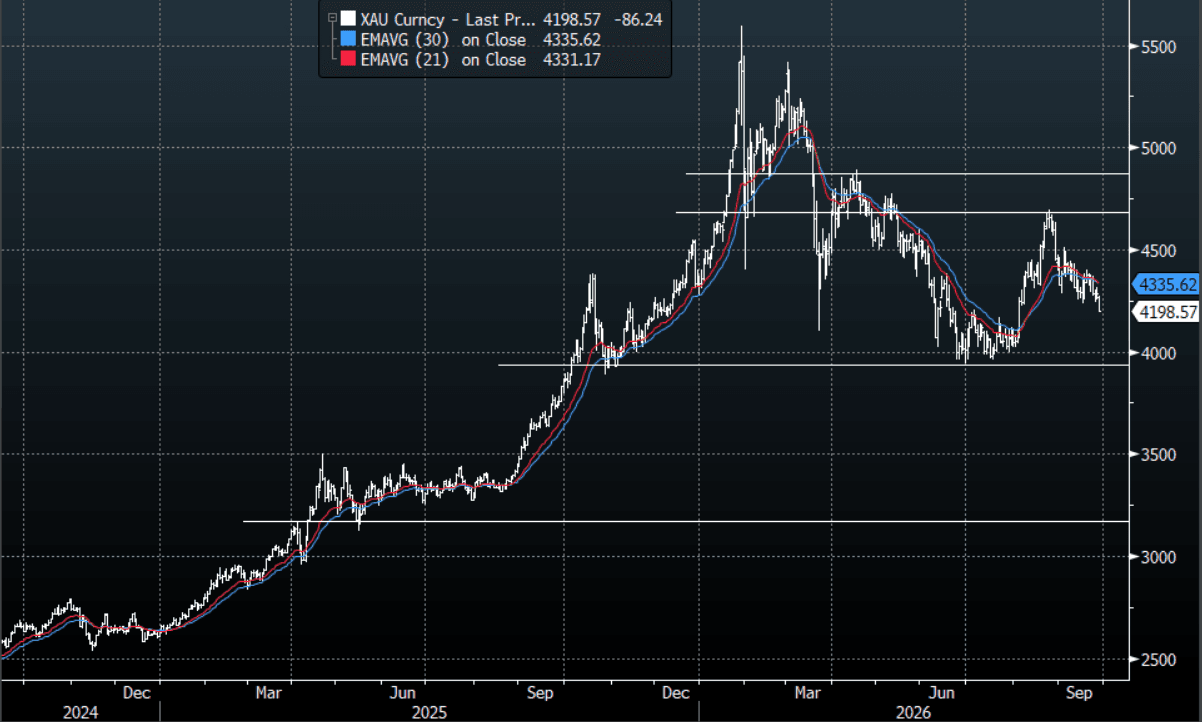
The range for Gold today in the Asia-Pac has been $4,191.57/oz - $4,275.23/oz, Asia is currently trading around $4197, -2.05%. The precious metal is picking up some momentum moving back toward the lows within its wider range. For the moment the competing forces for Gold could see it continue to chop around within the wider $3900-4900/oz range while the market works out how long this US hiking cycle could be as the Fed fights inflation and what that means for the US Dollar which is now attempting to break higher. Central banks though continue to acquire gold, China chief among them. Without all this institutional demand how much lower would Gold be ?
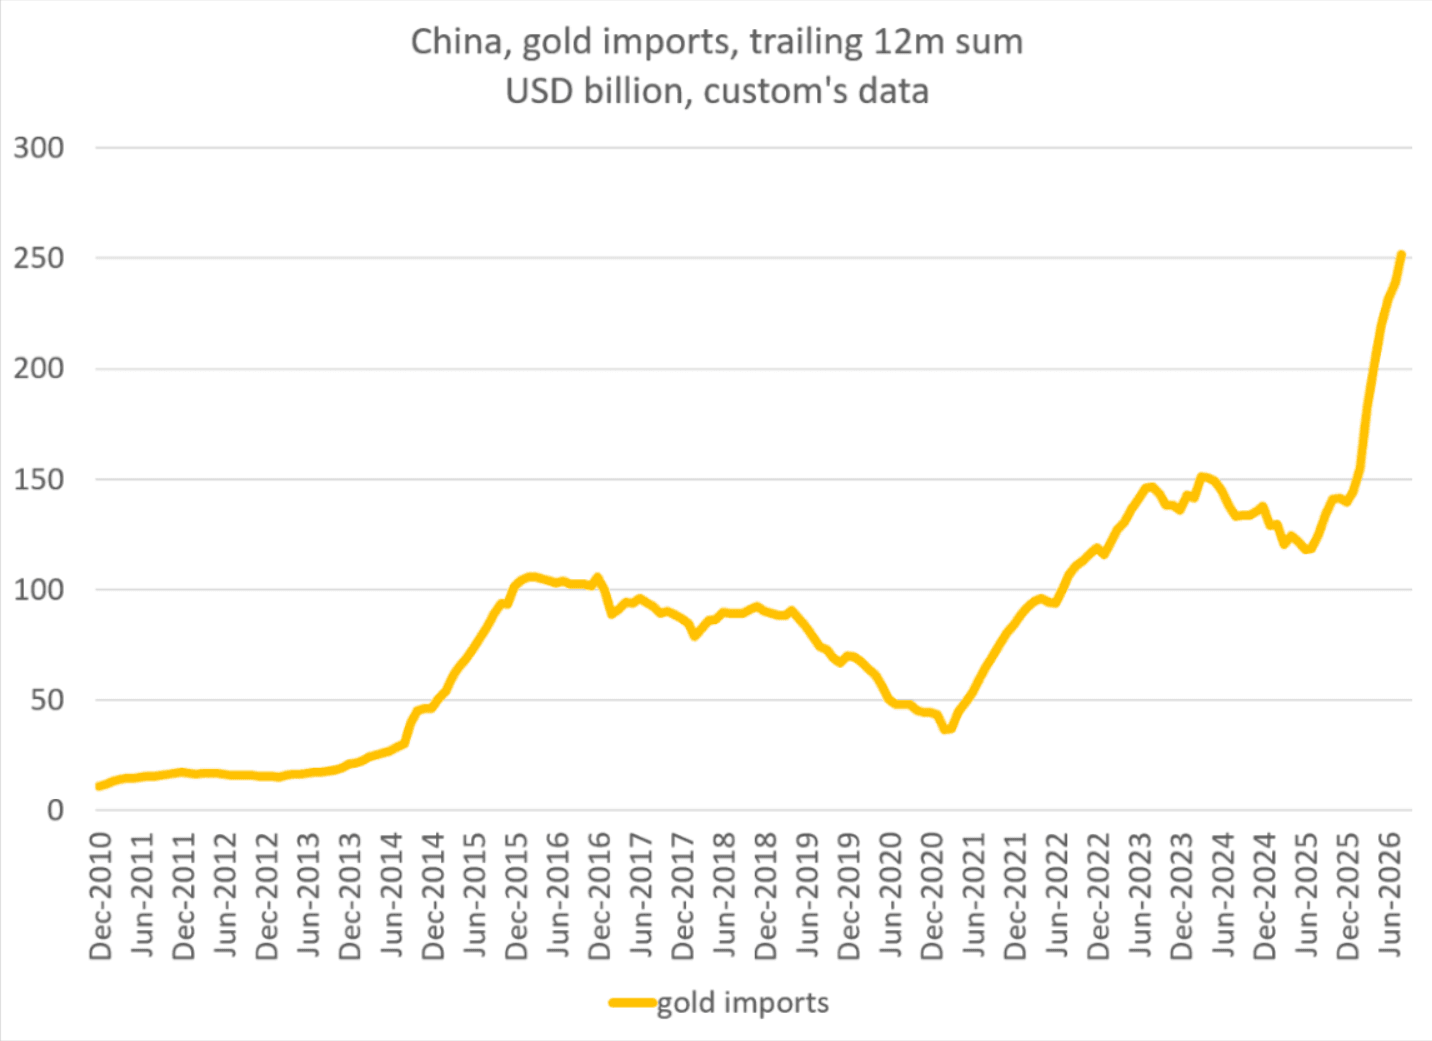
- Brad Setser: “A chart of Chinese gold imports (on a trailing 12m basis) looks a bit like a chart of Korean chip exports (or US computer imports). Curious how the IMF and others will handle this. The surge in imports of gold is really a surge in imports of financial assets -- yet it registers in the customs data and is big enough to have a material impact on the goods balance/ net exports.” Fig.1 below.
- (Financial Times) via BBG -- “China has spent a record sum importing more than 1,000 tonnes of gold this year as the central bank and local investors pour cash into bullion amid rising geopolitical tensions abroad and poor returns…”
- The XAU Average True Range(ATR) for the last 10 Trading days: $72.00/oz
Fig 1 : China Gold Imports
Source: MNI - Market News/@Brad_Setser
Fig 2 : Gold Daily Chart
Source: MNI - Market News/Bloomberg
FOREX: USD(BBDXY) - Looking To Consolidate Then Build On Break Higher
The BBDXY has had a range today of 1213.66 - 1215.02 in the Asia-Pac session; it is currently trading around 1213. US yields remain under pressure keeping the US Dollar well supported for now. This break higher looks potentially significant to me in the short-term and completely negates the pressure that had been building on the USD. I suspect we could now see the dips in the US Dollar become supported as the market potentially now turns its focus toward a test of the more pivotal 1230 area at some point down the line. Initial support is now back toward 1208-1211 and then the 1200-1205 area looking for the break to consolidate and then build momentum higher at some point.
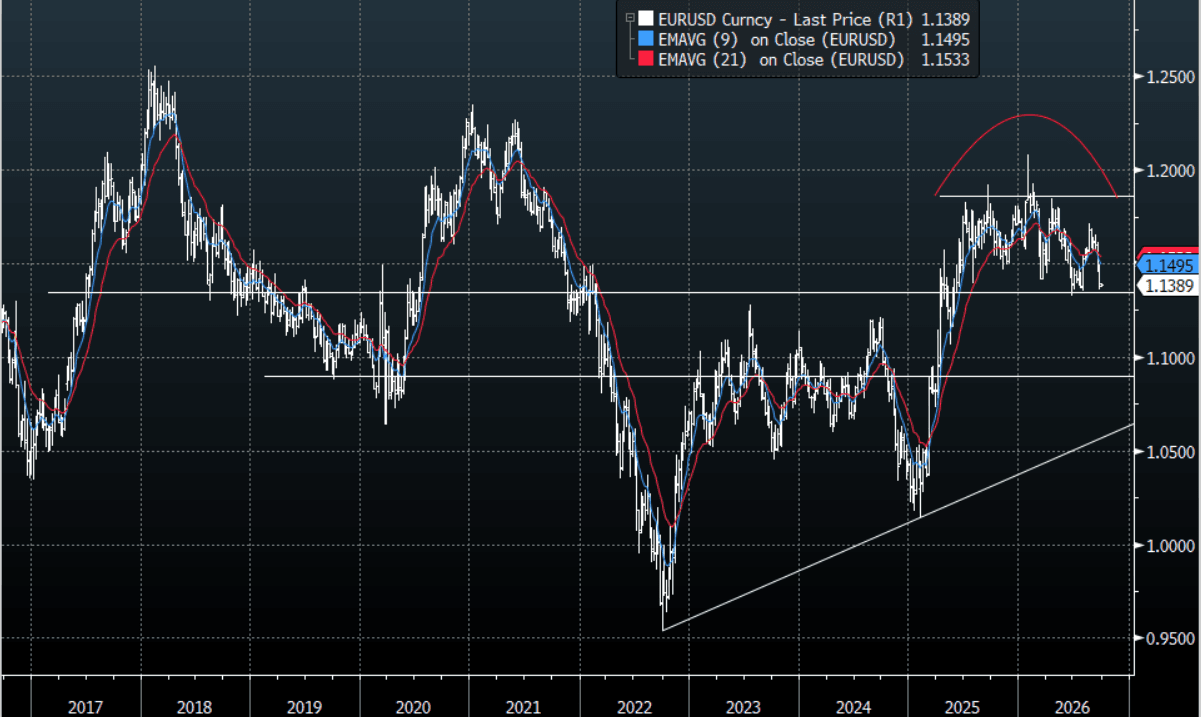
- EUR/USD - Asian range 1.1374-1.1391, Asia is currently trading 1.1390. The pair’s momentum has slowed but the price action remains pretty telling. This break in the USD looks potentially significant to me in the short-term and should add to the Euro’s headwinds. I have been skewed in favour of fading this rally in the EUR, the price action has now turned decidedly bearish and I suspect rallies are now likely to continue to be sold into. On the day the first resistance is back toward 1.1400-1.1440 through here the 1.1500 area comes back into play. Looking for a test of the 1.1300-1.1350 area at some point, a sustained break below here and we could target a move back toward 1.0900-1.1000.
- GBP/USD - Asian range 1.3224-1.3247, Asia is currently dealing around 1.3245. The pair continues to trade heavy after breaking back below the 1.3450 area. I suspect rallies could now be faded as momentum turns back toward the lower end of the 1.3150-1.3650 range. First resistance is back toward 1.3285-1.3315 and then the 1.3400-1.3450 area comes back into play.
Fig 1: EUR/USD Spot Weekly Chart
Source: MNI - Market News/Bloomberg Finance L.P


