EM CREDIT SUPPLY: Seazen Group - New $ bond FV
(FUTLAN, Caa1neg/Bneg/-)
New Issue: $TBA 3NCNP2
Tender: $ 7/25 and $10/25 notes
IPT: 13.25% area
FV: 12.85%
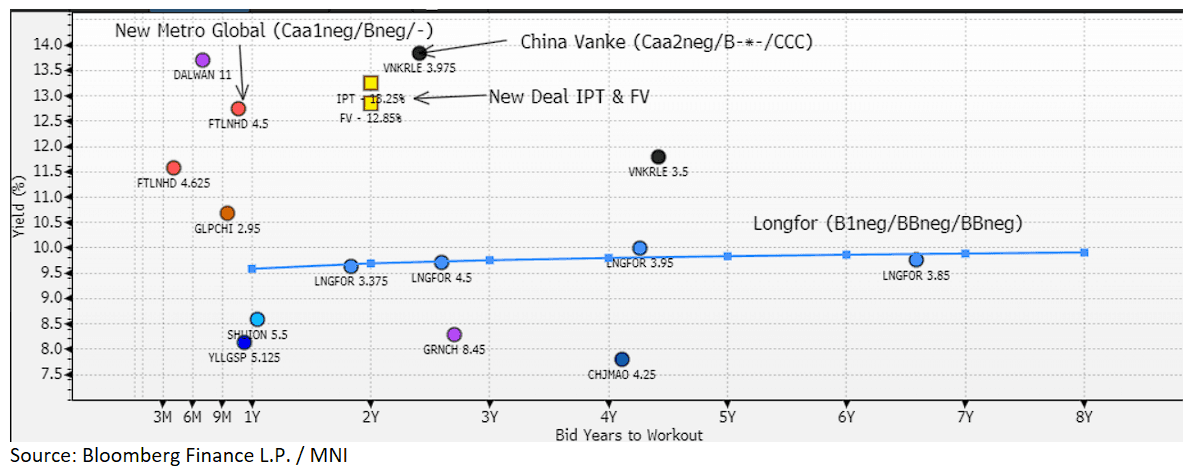
Seazen has come to the market to finance the tender of its $ 7/25 and 10/25 notes with a new $TBD 3NCNP2 at an IPT of 13.25% area. In terms of fair value we compare the proposed deal to the existing Seazen dollar bonds, notably from wholly owned subsidiary, New Metro Global (Caa2neg/-/-), as well as other low rated peers (Vanke, Longfor).
The existing New Metro Global $4.125 5/26 is currently yielding around 12.75%, we think the curve is worth perhaps another 10bp for a 1 year extension. The sector itself is supported, as evidenced by ongoing state back support for China Vanke from Shenzhen Metro Group, and the general expectation that the Chinese government would likely step in if needed.
China Vanke, despite similar ratings, has substantially more debt outstanding and I would expect Seazen bonds to trade inside. Indeed, Bloomberg reports FY2024 debt at China Vanke of RMB382bn compared to RMB59b at Seazen. The most recent data for China Vanke, indicated a cash ratio at end Q1 of only 0.5x, with a CNY85bn shortfall, which implies ongoing outside financial support is required.
We therefore see fair value around 12.85%. In terms of book building, we understand books are currently over $500m.
Want to read more?
Find more articles and bullets on these widgets:
Historical bullets
JGBS AUCTION: Poll: 30-Year JGB Auction
*JAPAN 30Y GOVT BOND AUCTION MAY HAVE 91.10 LOWEST PRICE:POLL – BLOOMBERG
JGBS AUCTION: 30Y Supply Faces A Much Higher Yield
The Japanese Ministry of Finance (MoF) will today sell Y800bn of 30-Year JGBs. The MoF last sold 30-year debt on 8 April 2025.
- This month’s 30-year JGB auction features an outright yield approximately 50–55 basis points higher than last month’s issuance. Notably, the current yield is hovering just below its cycle high of 3.0%.
- The 10s30s yield curve is now 5–10 basis points steeper than at the time of the previous auction, though still around 10 basis points below its recent peak.
- On a relative value basis, the 30-year bond remains largely unchanged versus last month when viewed through the 20-/30-/40-year butterfly spread.
- Today's supply comes amid weakening sentiment toward longer-dated global bonds, weighed down by positive trade deal developments, consistently strong U.S. economic data, and a further pushback in expectations for Fed rate cuts.
- Against this backdrop, today’s 30-year auction will serve as a key gauge of investor appetite in the face of heightened uncertainty.
- Results are due at 0435 BST / 1235 JT.
AUSTRALIA DATA: NAB Bus Conditions Continue To Trend Lower, Labor Costs Steady
The NAB Australian business survey saw conditions ease to +2 from a revised +3 reach in March. On the confidence front, the reading edged up to -1 from -3 prior. These headline measures aren't suggesting a sharp turnaround in domestic economic growth momentum in the near term.
- The first chart below plots NAB business conditions against GDP growth in y/y terms. Whilst the conditions measure is above the level of GDP growth, conditions have been trending lower since a cycle peak back in late 2022.
- Business confidence has largely tracked sideways in recent years, and struggled above to sustain positive readings.
Fig 1: NAB Australian Business Conditions Versus GDP Growth Y/Y

Source: NAB/MNI - Market News/Bloomberg
- In terms of the detail, trading conditions edged down to 5.2 from 5.7, while profitability fell to -4.2 from around flat prior. This is the weakest profit reading since 2020.
- The employment sub index edged down to 3.5, but has been fairly steady. The labour cost measure was unchanged at 1.6 and remains close to unchanged since late last year. The second chart below is of this metric versus the wage index published by the ABS (in y/y terms). This measure for Q1, prints tomorrow, with the y/y outcome projected unchanged at 3.2%y/y (which is consistent with recent NAB outcomes).
- The prices measure rose to 0.8 from 0.6 in March, but has been sub 1.0 since June last year.
Fig 2: NAB Australian Labour Costs Versus Wages Growth Y/Y

Source: NAB/MNI - Market News/Bloomberg