STIR: RBA-OIS Pricing Softens Further After CPI Data
Sep-30 05:15
August trimmed mean inflation rose 0.2% m/m, 0.1pp below consensus, to be up 3.6% y/y in line with J...
Want to read more?
Find more articles and bullets on these widgets:
Historical bullets
AUSSIE BONDS: Slightly Cheaper, Infl Gauge Up Ahead Of Wed's Q2 GDP/Price Data
Aug-31 05:12
ACGBs (YM -0.5 & XM -0.5) are slightly weaker on a relatively subdued day of trading .
- US tsys are 1-2bps richer, with a steepening bias, in today's Asia-Pac session.
- Given that underlying trimmed mean inflation held at 3.6% y/y in July, the focus will likely remain on data price information.
- The MI inflation gauge for August rose 0.5% m/m bringing the annual rate to 4.8% y/y, highest since December 2023. MI trimmed mean inflation, excluding volatile items, rose to 4.4% y/y from 4.2%.
- Q2 productivity/ULC and price deflators included in Wednesday's GDP release will also be in focus.
- Q2 GDP is forecast to rise 0.3% q/q and slow to 1.9% y/y from 2.5%. Net exports & public demand tomorrow.
- Cash ACGBs are little changed with the AU-US 10-year yield differential at +39bps.
- The bills strip pricing flat to -3 across contracts.
- RBA-dated OIS pricing shows tightening across all meetings, with the probability of a 25bp hike rising from 51% for September to 117% by December 2026.
- The AOFM plans to sell A$300mn of the 4.75% 21 June 2054 bond tomorrow, A$900mn of the 1.25% 21 May 2032 bond on Wednesday and A$800mn of the 4.75% 21 October 2037 bond on Friday.
BUND TECHS: (U6) Fresh Cycle Low
Aug-31 05:10
- RES 4: 125.74 High Jul 10
- RES 3: 125.51 High Aug 5 and a key resistance
- RES 2: 124.85 50-day EMA
- RES 1: 124.29 20-day EMA
- PRICE: 123.54 @ 05:53 BST Aug 31
- SUP 1: 123.49 Intraday low
- SUP 2: 123.09 1.000 proj of the Jun 30 - Jul 8 - 10 price swing
- SUP 3: 123.00 Round number support
- SUP 4: 122.46 1.236 proj of the Jun 30 - Jul 8 - 10 price swing
The trend needle in Bund futures futures continues to point south. The contract traded to a fresh cycle low on Friday, reinforcing bearish conditions and maintaining the price sequence of lower lows and lower highs. Note that moving average studies remain in a bear-mode position highlighting a dominant downtrend. Sights are on 123.09 next, a Fibonacci projection. Resistance to watch is around the 50-day EMA - currently at 124.85.
GOLD: Testing Key Resistance; Vol Likely to Climb
Aug-31 05:09
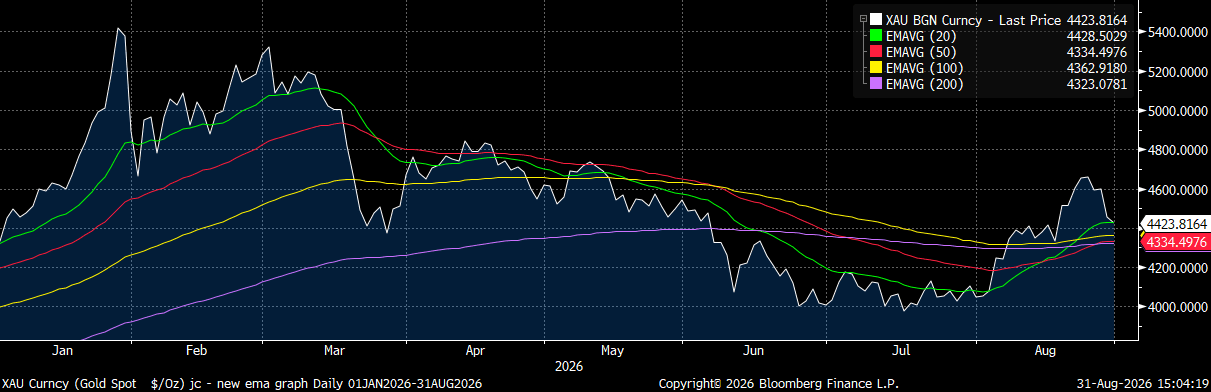
- The follow through for gold continued in Asia today with lossess of -0.66% to be at US$4,424.
- This sees bullion testing the 20-day EMA of $4,428. A break below seess the 50-day, 100-day and 200-day EMAs all converge
- The convergence of the 50, 100, and 200-day Exponential Moving Averages (EMAs) is a powerful technical signal. In technical analysis, this specific setup is known as an EMA Compression or a Moving Average Squeeze. Rather than signaling a direction, it serves as a major warning that a market is transitioning from a period of quiet consolidation into a phase of high volatility and explosive expansion.
- Because Chairman Warsh tied future monetary tightening strictly to economic indicators, macro data will cause heightened volatility. August purchasing managers' data will provide an updated health check on US economic momentum. Soft data could revive hopes of a Fed pause.Employment Indicators: Early labor data leading into the next nonfarm payrolls report will heavily swing market sentiment. Weakening jobs data typically cushions gold by dampening rate hike narratives.
Fig1: Gold Tests 20-day EMA
source Bloomberg FInance LP / MNI


