MNI DAILY TECHNICAL ANALYSIS - Volatile Oil Upswing Intact
Price Signal Summary - Volatile Oil Upswing Intact
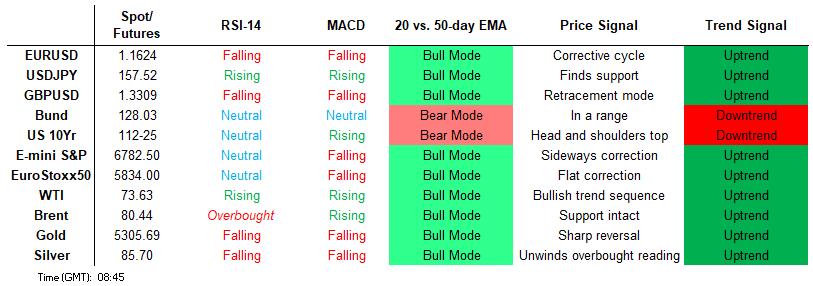
- S&P E-Minis are trading closer to their recent lows. For now, the contract remains inside a range. A continuation lower would open key support and the base of the current range at 6751.50. A strong short-term reversal in EUROSTOXX 50 futures has resulted in a breach of both the 20- and 50-day EMAs. This highlights potential for a deeper near-term pullback and opens 5854.50.
- The short-term trend condition in GBPUSD remains bearish and the latest sell-off reinforces current conditions. The break to a fresh cycle low confirms a resumption of the downtrend that started on Jan 27. Bullish trend conditions in USDJPY remain intact and Monday’s extension reinforces current conditions. Recent gains have resulted in a break above the 50-day EMA. The AUDUSD trend structure is unchanged, it remains bullish and recent fresh cycle highs reinforce this theme and have confirmed a resumption of the uptrend.
- A volatile bull cycle in WTI futures remains intact. However, recent gains highlight the fact that the contract is in an extreme overbought position. A deeper retracement would be considered corrective. Gold started this week on a bullish note, confirming an extension of the recovery since Feb 2. The metal has cleared all key retracement points of the sharp sell-off between Jan 29 - Feb 2.
- A sharp reversal in Bund futures yesterday highlights at the very least, a short-term top in the uptrend and the start of a correction. The trend is overbought and a pullback is allowing that condition to unwind. A bull cycle in Gilt futures remains intact, however the reversal from last Friday’s high and today’s gap lower, highlights at the very least a corrective cycle.
[GLOBAL] MNI Tech Trend Monitor - Highlighting Longer-Term Trends:
- Refreshing the MNI Tech Trend Monitor, Adding USDZAR, USDCNH and the e-mini S&P chart, while refreshing levels for Gold, USD/JPY, EUR/GBP, EUR/HUF, USD/MXN, the European Banking Stock Index (SX7E) as well as UK Gilts.
See full document here: Hidden PDF
FOREIGN EXCHANGE
EURUSD TECHS: Bear Leg Extends
- RES 4: 1.1975 High Jan 30
- RES 3: 1.1929 High Feb 10
- RES 2: 1.1878 High Feb 16
- RES 1: 1.1775/1.1835 50-day EMA / High Feb 23 and key resistance
- PRICE: 1.1665 @ 06:02 GMT Mar 3
- SUP 1: 1.1633 Low Jan 20
- SUP 2: 1.1573 Low Jan 19 and a key support
- SUP 3: 1.1556 Low Nov 28 ‘ 25
- SUP 4: 1.1491 Low Nov 21 ‘25
A bear cycle in EURUSD remains in play and Monday’s sharp sell-off reinforces current conditions. The pair has cleared 1.1742, the Feb 19 low, and this has been followed by a breach of 1.1693, the 76.4% retracement of the bull leg between Jan 19 - 27. The break strengthens a bearish theme and opens 1.1573, the Jan 19 low and a key support. On the upside, initial firm resistance to watch is 1.1835, the Feb 23 high.
GBPUSD TECHS: Bear Cycle Intact
- RES 4: 1.3712 High Feb 11
- RES 3: 1.3662 High Feb 16
- RES 2: 1.3575 High Feb 26 and a key S/T resistance
- RES 1: 1.3434 Low Feb 19
- PRICE: 1.3358 @ 06:21 GMT Mar 3
- SUP 1: 1.3314 Low Mar 02
- SUP 2: 1.3288 Low Dec 9 ‘25
- SUP 3: 1.3212 76.4% retracement of the Nov 4 ‘25 - Jan 27 bull cycle
- SUP 4: 1.3180 Low Dec 2 ‘25
The short-term trend condition in GBPUSD remains bearish and the latest sell-off reinforces current conditions. The break to a fresh cycle low confirms a resumption of the downtrend that started on Jan 27. Sights are on 1.3331, the Jan 19 low and the next key support. This level has been pierced, a clear break of it would strengthen a bear theme and open 1.3212, a Fibonacci retracement. Initial firm resistance is 1.3575, the Feb 26 high.
EURGBP TECHS: Volatile But Trend Theme Remains Bullish
- RES 4: 0.8840 High Nov 20 ‘25
- RES 3: 0.8818 High Nov 26 ‘25
- RES 2: 0.8806 76.4% retracement of the Nov 14 - Feb 4 bear leg
- RES 1: 0.8789 High Feb 27 and key short-term resistance
- PRICE: 0.8732 @ 06:38 GMT Mar 3
- SUP 1: 0.8712/8673 50-day EMA / Low Feb 6
- SUP 2: 0.8613 Low Feb 04 and bear trigger
- SUP 3: 0.8597 Low Aug 14
- SUP 4: 0.8578 Low Jul 2 ‘25
Despite current volatile price action, a bullish theme in EURGBP remains intact - for now. The cross has recently breached a key short-term resistance at 0.8746, the Jan 21 high, highlighting a stronger trend reversal. A resumption of gains would open 0.8806 next, a Fibonacci retracement. On the downside, the first key support to watch is 0.8712, the 50-day EMA, where a break is required to highlight a potential short-term bear reversal.
USDJPY TECHS: Trend Needle Points North
- RES 4: 160.00 Psychological round number
- RES 3: 159.45 High Jan 14 and the bull trigger
- RES 2: 159.23 High Jan 23
- RES 1: 157.76 High Feb 9
- PRICE: 157.24 @ 06:54 GMT Mar 3
- SUP 1: 155.48/154.00 50-day EMA / Low Feb 23
- SUP 2: 152.44 Trendline support drawn from the Apr 22 ‘25 low
- SUP 3: 152.10 Low Jan 27 and a bear trigger
- SUP 4: 151.54 Low Oct 29 ‘25
Bullish trend conditions in USDJPY remain intact and Monday’s extension reinforces current conditions. Recent gains have resulted in a break above the 50-day EMA. The continuation higher highlights a stronger reversal and sights are on 157.76 next, the Feb 9 high. Clearance of this level would open 159.45, the Jan 14 high and a key resistance. Initial firm support lies at 154.00, the Feb 23 low.
EURJPY TECHS: Channel Support Intact For Now
- RES 4: 186.87 High Jan 23 and a key M/T resistance
- RES 3: 186.36 High Feb 9
- RES 2: 185.05 76.4% retracement of the Feb 9 - 12 bear leg
- RES 1: 184.77 High Feb 25
- PRICE: 183.40 @ 07:32 GMT Mar 03
- SUP 1: 183.07/182.27 50-day EMA / Bull channel from Feb 28 ‘25 low
- SUP 2: 180.81 Low Feb 12
- SUP 3: 180.10 Low Dec 5 ‘25
- SUP 4: 179.30 23.6% of the Feb 28 ‘25 - Jan 23 bull cycle
Key support in EURJPY to monitor at 182.27, the base of a bull channel drawn from the Feb 28 ‘25 low. A clear break of this channel base is required to signal a stronger reversal and suggest scope for a deeper retracement. For bulls, the cross has recently traded through the 20-day EMA. The clear break of it highlights a potential short-term reversal and the start of a fresh bull cycle inside the channel. Sights are on 185.05, a Fibonacci retracement.
AUDUSD TECHS: Uptrend Remains Intact
- RES 4: 0.7208 61.8% of the Feb 25 ‘21 - Apr 9 ‘25 bear leg
- RES 3: 0.7186 2.236 proj of the Nov 21 - Dec 10 - 18 price swing
- RES 2: 0.7158 High Feb 2 2023
- RES 1: 0.7147 High Feb 12 and the bull trigger
- PRICE: 0.7086 @ 07:36 GMT Mar 3
- SUP 1: 0.7048 20-day EMA
- SUP 2: 0.6897 Low Feb 6 and key short-term support
- SUP 3: 0.6920 50-day EMA
- SUP 4: 0.6834 Low Jan 23
The AUDUSD trend structure is unchanged, it remains bullish and recent fresh cycle highs reinforce this theme and have confirmed a resumption of the uptrend. Note that moving average studies are in a bull-mode position and this set-up highlights a dominant medium-term uptrend. Potential is seen for a climb towards 0.7186 next, a Fibonacci projection. On the downside, initial key support is unchanged at 0.6897, the Feb 6 low.
USDCAD TECHS: Resistance Remains Intact
- RES 4: 1.3929 High Jan 16 and a reversal trigger
- RES 3: 1.3845 High Jan 22
- RES 2: 1.3800 High Jan 23
- RES 1: 1.3717/25 50-day EMA / High Feb 6 & 24 and key resistance
- PRICE: 1.3677 @ 07:56 GMT Mar 3
- SUP 1: 1.3594/3482 Low Feb 13 / Low Jan 30 and the bear trigger
- SUP 2: 1.3420 Low Sep 25 ‘24
- SUP 3: 1.3400 50.0% retracement of the 2021 - 2025 uptrend
USDCAD continues to trade below key short-term resistance at 1.3725, the Feb 6 and 24 high. A clear breach of this hurdle would highlight a potential reversal and suggest scope for a stronger short-term bull phase. For now, the medium-term trend structure remains bearish - moving average studies continue to highlight a dominant downtrend. A reversal lower would refocus attention on key support and the bear trigger at 1.3482, the Jan 30 low.
FIXED INCOME
BUND TECHS: (H6) Corrective Pullback
- RES 4: 131.00 Round number resistance
- RES 3: 130.91 3.764 proj of the Jan 23 - 29 - Feb 3 price swing
- RES 2: 130.78 3.618 proj of the Jan 23 - 29 - Feb 3 price swing
- RES 1: 129.76/130.53 Low Feb 27 / High Feb 2 and key resistance
- PRICE: 129.15 @ 08:20 GMT Mar 3
- SUP 1: 129.18/128.94 20-day EMA / Intraday low
- SUP 2: 128.73 50-day EMA
- SUP 3: 128.03 Low Feb 9
- SUP 4: 127.51 Low Jan 23 and a key support
A sharp reversal in Bund futures yesterday highlights at the very least, a short-term top in the uptrend and the start of a correction. The trend is overbought and a pullback is allowing that condition to unwind. Firm support lies at 129.18, the 20-day EMA. It has been pierced, a clear break would open the 50-day EMA at 128.73. A clear break of this 50-day average would highlight a stronger reversal. Key resistance is at 130.53, the Feb 2 high.
BOBL TECHS: (H6) Approaching The 50-Day EMA
- RES 4: 117.940 3.000 proj of the Jan 23 - Feb 2 - 3 price swing
- RES 3: 117.810 2.764 proj of the Jan 23 - Feb 2 - 3 price swing
- RES 2: 117.665 2.500 proj of the Jan 23 - Feb 2 - 3 price swing
- RES 1: 117.190/117.630 Low Feb 29 / High Mar 2 and key resistance
- PRICE: 116.700 @ 07:52 GMT Mar 3
- SUP 1: 116.690 Intraday low
- SUP 2: 116.652 Trendline support drawn from the Dec 22 ‘25 low
- SUP 3: 116.450 61.8% of the Dec 10 ‘25 - Mar 2 bull cycle
- SUP 4: 116.290 Low Feb 3
A sharp sell-off in Bobl futures yesterday and today’s follow through highlights the start of a short-term bear cycle. The contract has traded through the 50-day average, at 116.753, and attention turns to a trendline support at 116.652. The trendline is drawn from the Dec 22 ‘25 low. A clear break of both support points would highlight a stronger reversal. For now, the move lower is considered corrective. Key resistance is at 117.630, Monday’s high.
SCHATZ TECHS: (H6) Clears Support
- RES 4: 107.075 High Mar 2 and key resistance
- RES 3: 106.960 Low Feb 27
- RES 2: 106.917 50-day EMA
- RES 1: 106.850 Intraday high
- PRICE: 106.800 @ 06:14 GMT Mar 3
- SUP 1: 106.755 Intraday low
- SUP 2: 106.735 76.4% retracement of the Dec 10 ‘25 - Mar 2 bull leg
- SUP 3: 106.690 Low Dec 18 / 22 ‘25
- SUP 4: 106.630 Low Dec 10 ‘25 and a key support
A sharp sell-off in Schatz futures has resulted in a move through both the 20- and 50-day EMAs. Price has also breached a trendline drawn from the Dec 10 low. The break of these technical tools highlights a stronger short-term reversal and signals scope for a deeper retracement. Sights are on 106.735, a Fibonacci retracement. Initial firm resistance is seen at 106.917, the 50-day EMA.
GILT TECHS: (M6) Pullback Highlights The Start Of A Correction
- RES 4: 94.79 1.236 projection of the Feb 9 - 17 - 19 price swing
- RES 3: 94.22 1.000 projection of the Feb 9 - 17 - 19 price swing
- RES 2: 94.00 Round number resistance
- RES 1: 92.87/93.72 Low Mar 2 and gap high / High Feb 27
- PRICE: 92.41 @ 08:06 GMT Mar 3
- SUP 1: 92.21 20-day EMA
- SUP 2: 91.81 Low Feb 19 and a key short-term support
- SUP 3: 91.59 Low Feb 16
- SUP 4: 91.46 Low Feb 13
A bull cycle in Gilt futures remains intact, however the reversal from last Friday’s high and today’s gap lower, highlights at the very least a corrective cycle. Note that the trend is overbought. A deeper pullback would allow this condition to unwind. Initial firm support lies at 91.81, the Feb 19 low. On the upside, key short-term resistance and the bull trigger has been defined at 93.72, the Feb 27 high.
BTP TECHS: (H6) Monitoring Support
- RES 4: 123.84 High Dec 5 ‘24 and a key resistance
- RES 3: 123.37 3.236 proj of the Dec 10 - 17 - 22 price swing
- RES 2: 123.08 3.000 proj of the Dec 10 - 17 - 22 price swing
- RES 1: 122.96 High Feb 27 and the bull trigger
- PRICE: 121.83 @ 07:11 GMT Mar 3
- SUP 1: 121.40 50-day EMA
- SUP 2: 121.12 Trendline drawn from the Dec 10 low
- SUP 3: 120.36 Low Jan 20
- SUP 4: 119.72 Low Jan 6
A strong sell-off in BTP futures highlights a short-term top - for now. The contract has traded through the 20-day EMA and attention turns to the next two key supports; 121.40, the 50-day EMA, and 121.12, a trendline drawn from the Dec 10 ‘25 low. A clear break of these two levels would highlight a stronger reversal. For now the move down appears corrective. Key resistance and the bull trigger has been defined at 122.96, the Feb 27 high.
EQUITIES
EUROSTOXX50 TECHS: (H6) Short-Term Reversal
- RES 4: 6300.00 Round number resistance
- RES 3: 6257.00 1.764 proj of the Nov 21 - Dec 12 - 18 price swing
- RES 2: 6209.00 High Feb 26 and the bull trigger
- RES 1: 6066.75 20-day EMA
- PRICE: 5895.00 @ 08:04 GMT Mar 3
- SUP 1: 5887.00 Intraday low
- SUP 2: 5854.50 50.0% retracement of the Nov 21 ‘25 - Feb 26 bull leg
- SUP 3: 5689.00 Low Dec 18 ‘25
- SUP 4: 5667.32 61.8.0% of the Nov 21 ‘25 - Feb 26 bull leg
A strong short-term reversal in EUROSTOXX 50 futures has resulted in a breach of both the 20- and 50-day EMAs. This highlights potential for a deeper near-term pullback and opens 5854.50, a Fibonacci retracement point. Note that a clear break of the 50-day EMA would also undermine the broader uptrend and signal a potential medium-term reversal. Initial resistance to watch is 6083.00, the Mar 2 high.
E-MINI S&P: (H6) Bear Leg Inside Its Range
- RES 4: 7066.70 1.000 proj of the Feb 6 - 11 - 17 price swing
- RES 3: 7043.00 High Jan 28 and bull trigger
- RES 2: 6983.75 High Feb 25
- RES 1: 6912.32 50-day EMA
- PRICE: 6825.50 @ 06:52 GMT Mar 3
- SUP 1: 6751.50 Low Feb 6 and key short-term support
- SUP 2: 6733.00 Low Nov 25 ‘25
- SUP 3: 6691.56 76.4% retracement of the Nov 21 - Jan 28 bull leg
- SUP 4: 6583.00 Low Nov 21 ‘25 and a key medium-term support
S&P E-Minis are trading closer to their recent lows. For now, the contract remains inside a range. A continuation lower would open key support and the base of the current range at 6751.50, the Feb 6 low, where a break would highlight a bear threat. On the upside, a resumption of gains and a breach of 6983.75, the Feb 25 high, would refocus attention on key resistance and the range top at 7043.00, the Jan 28 high.
COMMODITIES
BRENT TECHS: (K6) Volatile Bull Cycle Is Overbought
- RES 4: $88.03 - 3.236 proj of the Feb 17 - 23 - 26 price swing
- RES 3: $86.00 - Round number resistance
- RES 2: $84.42 - 2.618 proj of the Feb 17 - 23 - 26 price swing
- RES 1: $82.37 - High Mar 2
- PRICE: $80.11 @ 06:57 GMT Mar 3
- SUP 1: $75.75 - Low Mar 2
- SUP 2: $69.93 - 20-day EMA
- SUP 3: $66.97 - 50-day EMA
- SUP 4: $64.51 - Low Feb 3
A volatile bull cycle in Brent futures remains intact. Note that the uptrend is in an extreme overbought position. A deeper pullback from Monday’s high would be considered corrective and allow this overbought position to unwind. First key support to watch lies at $69.93, the 20-day EMA. For bulls, a resumption of gains would pave the way for a climb towards $84.42 next, a Fibonacci projection.
WTI TECHS: (J6) Bullish But Overbought
- RES 4: $81.46 - 3.236 proj of the Feb 17 - 23 - 26 price swing
- RES 3: $80.00 - Round number resistance
- RES 2: $78.05 - 2.618 proj of the Feb 17 - 23 - 26 price swing
- RES 1: $75.33 - High Feb 2
- PRICE: $73.11 @ 07:07 GMT Mar 3
- SUP 1: $69.20 - Low Mar 2
- SUP 2: $65.00 - 20-day EMA
- SUP 3: $62.58 - 50-day EMA
- SUP 4: $59.94 - Low Jan 27
A volatile bull cycle in WTI futures remains intact. However, recent gains highlight the fact that the contract is in an extreme overbought position. A deeper retracement would be considered corrective and this would allow the overbought condition to unwind. The first key support to monitor is $65.00, the 20-day EMA. For bulls, a resumption of gains would pave the way for a climb towards $78.05 next, a Fibonacci projection.
GOLD TECHS: Holding On To The Bulk Of Its Recent Gains
- RES 4: $5700.0 - Round number resistance
- RES 3: $5654.3 - 2.500 proj of the Nov 18 - Dec 26 - 31‘25 swing
- RES 2: $5595.5 - High Jan 29 and key resistance
- RES 1: $5451.0 - High Jan 30
- PRICE: $5312.4 @ 07:12 GMT Mar 3
- SUP 1: $5075.8 - 20-day EMA
- SUP 2: $4982.0 - Low Feb 20
- SUP 3: $4841.3 - 50-day EMA
- SUP 4: $4655.7 - Low Feb 6
Gold started this week on a bullish note, confirming an extension of the recovery since Feb 2. The metal has cleared all key retracement points of the sharp sell-off between Jan 29 - Feb 2. The move higher strengthens the short-term bullish theme and signals scope for an extension towards key resistance and the bull trigger at $5595.5, the Jan 29 high. Initial firm support to watch lies at $5075.8, the 20-day EMA.
SILVER TECHS: Retracement Mode
- RES 4: $121.654 - High Jan 30 and key resistance
- RES 3: $108.071 - 76.4% retracement of the Jan 29 - Feb 6 sell-off
- RES 2: $100.000 - Round number resistance
- RES 1: $97.804 - High Mar 2
- PRICE: $95.664 @ 08:16 GMT Mar 2
- SUP 1: $83.020 - Intraday low
- SUP 2: $81.540 - 50-day EMA
- SUP 3: $72.020 - Low Feb 17
- SUP 4: $64.098 - Low Feb 6 and the bear trigger
A short-term volatile bull cycle in Silver remains intact and recent gains reinforce this theme. A resumption of gains would pave the way for a climb towards $99.668, the 61.8% retracement of the sell-off between Jan 29 - Feb 6. A move through this price point would expose 108.071, the 76.4% retracement. Key short-term support to watch lies at $81.540, the 50-day EMA. A breach of this average would be a bearish development.