MNI DAILY TECHNICAL ANALYSIS - USDJPY Tilted Toward Resistance
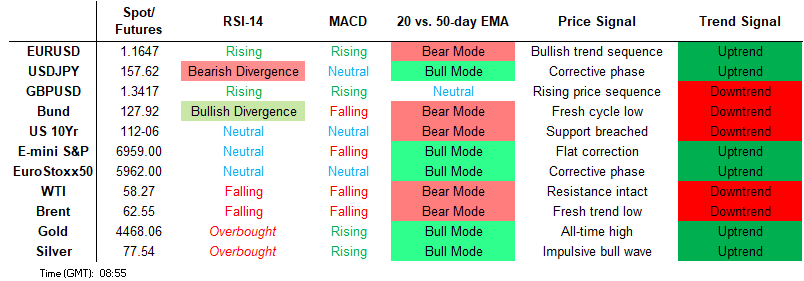
Price Signal Summary – USDJPY Tilted Toward Resistance
- The trend condition in S&P E-Minis is unchanged, it remains bullish and price continues to trade above key near-term support at 6771.50, the Dec 18 low. A bull cycle in EUROSTOXX 50 futures remains intact and the contract is holding on to the bulk of its latest gains. The move higher this week confirms a resumption of the primary uptrend.
- USDJPY maintains a firmer tone. The trend structure is bullish and note that moving average studies are in a bull-mode position, highlighting a dominant uptrend. Sights are on 157.89, the Nov 20 high and a bull trigger. Weakness in AUDUSD appears corrective and this is allowing an overbought condition to unwind. Initial firm support lies at 0.6677, the 20- day EMA. Support at the 50-day EMA, lies at 0.6625. This week’s extension higher in USDCAD undermines the current bearish theme, signalling scope for a stronger short-term bull phase. The pair is through the 50-day EMA, at 1.3845.
- The trend structure in Gold is unchanged, it remains bullish and a sharp sell-off late December appears to have been a correction The trend is overbought and any deeper retracement would allow this condition to unwind. The trend structure in WTI futures remains bearish and recent gains appear corrective. Moving average studies are in a bear-mode position, highlighting a dominant downtrend.
- Bund futures are holding on to this week’s gains. The latest rally does undermine the bear theme and attention is on resistance around the 50-day EMA, at 128.31. Gilt futures traded sharply higher Wednesday. The contract is through resistance at 91.93, the Nov 27 high. This strengthens a short-term bullish condition and paves the way for a climb towards 92.57.
[CROSS ASSET] MNI Tech Trend Monitor
- We refresh our Global Tech Trend Monitor, adding longer-term techs for USDMXN, EURHUF, EURGBP, Bitcoin and the USD Index as well as refreshing levels for Spot Gold, Silver, USDJPY, UK Gilt Yields and the Europe Banking Stock Index (SX7E).
See full document here: Hidden PDF
FOREIGN EXCHANGE
EURUSD TECHS: Bear Theme Remains Intact
- RES 4: 1.1919 High Sep 17 and a key M/T resistance
- RES 3: 1.1848 High Sep 18
- RES 2: 1.1808 High Dec 24 and the bull trigger
- RES 1: 1.1713/65 20-day EMA / High Jan 2
- PRICE: 1.1649 @ 06:13 GMT Jan 9
- SUP 1: 1.1639 50.0% retracement of the Nov 5 - Dec 12 bull leg
- SUP 2: 1.1615 Low Dec 9
- SUP 3: 1.1598 61.8% retracement of the Nov 5 - Dec 12 bull leg
- SUP 4: 1.1549 76.4% retracement of the Nov 5 - Dec 12 bull leg
EURUSD is trading at this week’s lows. Yesterday’s move down resulted in a print below support at 1.1659, the Jan 5 low. This cancels a possible reversal signal on Jan 5 - a dragonfly doji candle pattern. For now, a bearish theme appears likely to dominate and sights are on 1.1639, a Fibonacci retracement. Initial resistance is at 1.1713, the 20-day EMA. A clear break of the average would highlight a second possible reversal signal.
GBPUSD TECHS: Corrective Pullback
- RES 4: 1.3726 High Sep 17 and a key resistance
- RES 3: 1.3661 High Sep 18
- RES 2: 1.3607 2.764 proj of the Nov 4 - 13 - 20 price swing
- RES 1: 1.3568 High Jan 6
- PRICE: 1.3426 @ 06:21 GMT Jan 9
- SUP 1: 1.3416 Low Jan 8
- SUP 2: 1.3379 50-day EMA
- SUP 3: 1.3288 Low Dec 9
- SUP 4: 1.3180 Low Dec 2
The trend theme in GBPUSD remains bullish and the latest pullback appears corrective. The pair has pierced a resistance at 1.3557, the 76.4% retracement of the Sep 17 - Nov 4 bear leg. A clear break of this level would pave the way for a climb towards 1.3607, a Fibonacci projection. Key short-term support is seen at 1.3379, the 50-day EMA. A clear breach of it would signal a short-term reversal.
EURGBP TECHS: SHort-Term Trend Needle Points South
- RES 4: 0.8797 High Dec 17
- RES 3: 0.8774 High Dec 19
- RES 2: 0.8734 50-day EMA
- RES 1: 0.8703 Low Dec 30
- PRICE: 0.8677 @ 06:38 GMT Jan 9
- SUP 1: 0.8644 Low Jan 6
- SUP 2: 0.8633 Low Sep 15
- SUP 3: 0.8620 38.2% retracement of the Dec ‘24 - Nov ‘25 bull cycle
- SUP 4: 0.8597 Low Aug 14
A sharp sell-off in EURGBP earlier this week confirms a resumption of the current bear cycle. Moving average studies remain in a bear-mode position, highlighting a dominant downtrend. Scope is seen for a move towards 0.8620, a Fibonacci retracement point. On the upside, resistance to watch is 0.8734, the 50-day EMA. A break of this average is required to highlight a possible reversal.
USDJPY TECHS: Bullish Trend Sequence
- RES 4: 158.87 High Jan 10 and a key resistance
- RES 3: 158.29 2.618 projection of the Sep 17 - 26 - Oct 1 price swing
- RES 2: 158.00 Round number resistance
- RES 1: 157.89 High Nov 20 and the bull trigger
- PRICE: 157.39 @ 06:55 GMT Jan 9
- SUP 1: 156.36/155.25 20- and 50-day EMA values
- SUP 2: 154.35 Low Dec 5 and a bear trigger
- SUP 3: 153.62 Low Nov 14
- SUP 4: 152.82 Low Nov 7
USDJPY maintains a firmer tone. The trend structure is bullish and note that moving average studies are in a bull-mode position, highlighting a dominant uptrend. Sights are on 157.89, the Nov 20 high and a bull trigger. A move through this hurdle would confirm a resumption of the trend. Support to watch lies at 155.25, the 50-day EMA. A clear breach of it would undermine the bull theme and signal scope for a deeper correction.
EURJPY TECHS: Bull Continuation Pattern
- RES 4: 186.52 Bull channel top drawn from the Feb 28 low
- RES 3: 185.77 2.5000 proj of the Jul 31 - Sep 29 - Oct 2 price swing
- RES 2: 184.92 High Dec 22
- RES 1: 184.43 High Jan 2
- PRICE: 183.33 @ 07:02 GMT Jan 9
- SUP 1: 182.25 Low Dec 19
- SUP 2: 181.57 Low Dec 17
- SUP 3: 181.38 50-day EMA
- SUP 4: 180.10 Low Dec 5
The trend needle in EURJPY continues to point north. The current flat correction still appears to be a flag formation - a bullish continuation pattern. Sights are on 186.52, the top of a bull channel drawn from the Feb 28 low. This level also represents a key resistance point. Note that support at 183.14, the 20-day EMA, has been pierced. A clear breach of it would signal the start of a stronger corrective cycle.
AUDUSD TECHS: Approaching A Key Support Zone
- RES 4: 0.6872 38.2% retracement of the 2021 - 2025 L/T downtrend
- RES 3: 0.6858 1.000 proj of the Nov 21 - Dec 10 - 18 price swing
- RES 2: 0.6795 0.764 proj of the Nov 21 - Dec 10 - 18 price swing
- RES 1: 0.6767 High Jan 7
- PRICE: 0.6682 @ 07:59 GMT Jan 9
- SUP 1: 0.6677 20-day EMA
- SUP 2: 0.6625 50-day EMA
- SUP 3: 0.6593 Low Dec 18
- SUP 4: 0.6553 Low Dec 3
Weakness in AUDUSD appears corrective and this is allowing an overbought condition to unwind. Initial firm support lies at 0.6677, the 20- day EMA. Support at the 50-day EMA, lies at 0.6625. The area between the two EMAs represents a key support zone. Recent gains resulted in a breach of 0.6728, the Dec 29 high and a bull trigger, confirming a resumption of the current uptrend. This opens 0.6795 next, a Fibonacci projection.
USDCAD TECHS: Holding On To This Week’s Gains
- RES 4: 1.3977 High Dec 4
- RES 3: 1.3950 61.8% retracement of the Nov 5 - Dec 26 bear leg
- RES 2: 1.3925 Low Dec 4
- RES 1: 1.3892 50.0% retracement of the Nov 5 - Dec 26 bear leg
- PRICE: 1.3871 @ 08:03 GMT Jan 9
- SUP 1: 1.3786 20-day EMA
- SUP 2: 1.3701 Low Jan 2
- SUP 3: 1.3643 Low Dec 26 and the bear trigger
- SUP 4: 1.3576 Low Jul 23t
This week’s extension higher in USDCAD undermines the current bearish theme, signalling scope for a stronger short-term bull phase. The pair is through the 50-day EMA, at 1.3845. A clear break of this average would also highlight a stronger reversal. Sights are on 1.3892 next, a Fibonacci retracement. Initial support to watch is 1.3786, the 20-day EMA. A breach of it would highlight a possible reversal.
FIXED INCOME
BUND TECHS: (H6) MOnitoring Resistance At The 50-Day EMA
- RES 4: 129.66 High Nov 12
- RES 3: 128.75 High Dec 3 and a key resistance
- RES 2: 128.52 High Dec 5
- RES 1: 128.31 50-day EMA
- PRICE: 127.87 @ 05:43 GMT Jan 9
- SUP 1: 127.13/126.75 Low Jan 6 / Low Dec 22 and the bear trigger
- SUP 2: 126.53 Low Mar 11 (cont.) and a key support
- SUP 3: 126.35 3.236 projection of the Nov 12 - 20 - 26 price swing
- SUP 4: 126.20 3.382 projection of the Nov 12 - 20 - 26 price swing
Bund futures are holding on to this week’s gains. The latest rally does undermine the bear theme and attention is on resistance around the 50-day EMA, at 128.31. A clear break of this average would highlight a stronger reversal and signal scope for a continuation higher, towards 128.75, the Dec 3 high. Key support and the bear trigger is unchanged at 126.75, the Dec 22 low.
BOBL TECHS: (H6) Corrective Cycle Still In Play
- RES 4: 116.805 76.4% retracement of the Nov 26 - Dec 10 bear leg
- RES 3: 116.720 High Dec 4
- RES 2: 116.598 61.8% retracement of the Nov 26 - Dec 10 bear leg
- RES 1: 116.500 High Jan 7
- PRICE: 116.310 @ 03:11 GMT Jan 9
- SUP 1: 16.246 20-day EMA
- SUP 2: 115.920/720 Low Jan 5 / Low Dec 10 and the bear trigger
- SUP 3: 115.660.4.000 proj of the Nov 6 - 14 - 26 price swing
- SUP 4: 115.600 Round number support
The trend set-up in Bobl futures is unchanged, the condition remains bearish and the latest recovery appears corrective - for now. However, Wednesday’s gains undermine the bearish theme and highlights a potentially stronger short-term bull cycle. A continuation higher would open 116.598, a Fibonacci retracement. For bears, a reversal lower would refocus attention on 115.720, the Dec 10 low and bear trigger.
SCHATZ TECHS: (H6) Corrective Phase In Play
- RES 4: 107.000 Round number resistance
- RES 3: 106.945 High Dec 3 and a key resistance
- RES 2: 106.896 61.8% retracement of the Nov 21 - Dec 10 bear leg
- RES 1: 106.880 High Jan 7
- PRICE: 106.820 @ 06:12 GMT Jan 9
- SUP 1: 106.725 Low Jan 5
- SUP 2: 106.690 Low Dec 18 & 22
- SUP 3: 106.630 Low Dec 10 and the bear trigger
- SUP 4: 106.621 2.236 proj of the Nov 26 - Dec 2 - 3 minor price swing
A bear theme in Schatz futures remains intact and short-term gains are considered corrective. Recent gains do however highlight a stronger short-term bull cycle and the contract is trading closer to this week’s highs. A continuation higher would open 106.896 next, a Fibonacci retracement. For bears, a reversal would refocus attention on key support and bear trigger at 106.630, the Dec 10 low.
GILT TECHS: (H6) Resistance Breached
- RES 4: 92.72 1.618 proj of the Dec 16 - 17 - 22 price swing
- RES 3: 92.57 1.00 proj of the Nov 19 - 27 - Dec 16 price swing
- RES 2: 92.23 1.236 proj of the Dec 16 - 17 - 22 price swing
- RES 1: 92.18 High Jan 7
- PRICE: 92.02 @ Close Jan 8
- SUP 1: 91.53 Low Jan 7
- SUP 2: 91.29 20-day EMA
- SUP 3: 90.70 Low Jan 2
- SUP 4: 90.50 Low Dec 16 and a key support
Gilt futures traded sharply higher Wednesday. The contract is through resistance at 91.93, the Nov 27 high. This strengthens a short-term bullish condition and paves the way for a climb towards 92.57, a Fibonacci projection. Initial support is seen at 91.53, the Jan 7 low. Support at the 20-day EMA lies at 91.29. A break of the average would signal a possible reversal.
BTP TECHS: (H6) Has Breached Resistance
- RES 4: 121.37 High Nov 13
- RES 3: 121.24 High Nov 26
- RES 2: 121.06 High Dec 1
- RES 1: 120.83 High Jan 7
- PRICE: 120.50 @ Close Jan 8
- SUP 1: 120.18/119.45 20-day EMA / Low Dec 22
- SUP 2: 119.13 Low Dec 10 and the bear trigger
- SUP 3: 118.00 Round number support
- SUP 4: 118.84 2.000 proj of the Nov 13 - 20 - 26 price swing
A strong rally this week in BTP futures has cancelled a recent bearish threat, for now. The break of resistance at 120.59, the Dec 29 high and key short-term resistance, signals scope for a continuation of the bull leg and opens 121.06 next, the Dec 1 high. On the downside, initial support to watch lies at 120.18, the 20-day EMA. A clear break through this average would highlight a possible bearish development.
EQUITIES
EUROSTOXX50 TECHS: (H6) Bullish Trend Condition
- RES 4: 6086.99 1.236 proj of the Nov 21 - Dec 12 - 18 price swing
- RES 3: 6011.00 1.000 proj of the Nov 21 - Dec 12 - 18 price swing
- RES 2: 6000.00 Round number resistance
- RES 1: 5965.00 High Jan 6 & 7
- PRICE: 5944.00 @ 06:30 GMT Jan 9
- SUP 1: 5847.00/5819.97 High Nov 13 / 20-day EMA
- SUP 2: 5738.76 50-day EMA
- SUP 3: 5689.00 Low Dec 18
- SUP 4: 5655.00 Low Dec 1
A bull cycle in EUROSTOXX 50 futures remains intact and the contract is holding on to the bulk of its latest gains. The move higher this week confirms a resumption of the primary uptrend. Note too that moving average studies are in a bull-mode position, highlighting a dominant uptrend. Sights are on the 6000.00 handle next. On the downside, initial firm support to watch is 5819.97, the 20-day EMA. A pullback would be considered corrective.
E-MINI S&P: (H6) Bullish Outlook
- RES 4: 7080.92 0.764 proj Nov 21 - Dec 11 - 18 price swing
- RES 3: 7021.79 0.618 proj Nov 21 - Dec 11 - 18 price swing
- RES 2: 7014.00 High Oct 30 and the bull trigger
- RES 1: 7006.75 High Jan 7
- PRICE: 6958.50 @ 07:23 GMT Jan 9
- SUP 1: 6877.04 50-day EMA
- SUP 2: 6771.50 Low Dec 18 and a key support
- SUP 3: 6684.50 Low Nov 24
- SUP 4: 6583.00 Low Nov 21 and a reversal trigger
The trend condition in S&P E-Minis is unchanged, it remains bullish and price continues to trade above key near-term support at 6771.50, the Dec 18 low. Clearance of this level is required to signal scope for a deeper retracement and would also highlight a possible short-term reversal. For bulls, sights are on key resistance at 7014.00, the Oct 30 high. A move through this hurdle would confirm a resumption of the primary uptrend.
COMMODITIES
BRENT TECHS: (H6) Trades Through The 50-Day EMA
- RES 4: $70.06 - High Jul 30
- RES 3: $68.58 - High Sep 26
- RES 2: $64.81 - High Oct 24 and a key resistance
- RES 1: $63.02 - High Jan 8
- PRICE: $62.76 @ 07:08 GMT Jan 9
- SUP 1: $58.53 - Low Dec 16
- SUP 2: $58.27 - Low Apr 9 and a key support
- SUP 3: $57.87 - 1.764 proj of the Jul 30 - Aug 13 - Sep 26 price swing
- SUP 4: $56.44 - 2.000 proj of the Jul 30 - Aug 13 - Sep 26 price swing
A recovery in Brent futures yesterday has resulted in a break of resistance around the 50-day EMA, at $61.92. The break highlights a short-term improvement in the current bull theme and signals scope for an extension of the corrective cycle. The trend condition remains bearish and a reversal lower would $58.27, the Apr 9 low. Key resistance to watch is $64.81, the Oct 24 high. A breach of this hurdle would highlight a stronger reversal.
WTI TECHS: (G6) Monitoring Resistance
- RES 4: $70.16 - High Jun 23 and a key medium-term resistance
- RES 3: $64.97 - High Sep 26
- RES 2: $61.25 - High Oct 24 and a key resistance
- RES 1: $58.88 - High Dec 26
- PRICE: $58.47 @ 07:21 GMT Jan 9
- SUP 1: $54.89 - Low Dec 16
- SUP 2: $54.71 - Low Apr 9 and a key support
- SUP 3: $53.77 - 1.764 proj of the Jul 30 - Aug 13 - Sep 26 price swing
- SUP 4: $52.27 - 2.000 proj of the Jul 30 - Aug 13 - Sep 26 price swing
The trend structure in WTI futures remains bearish and recent gains appear corrective. Moving average studies are in a bear-mode position, highlighting a dominant downtrend. Note that resistance at the 50-day EMA, at $58.29, has been pierced. A clear breach of the EMA would signal scope for a stronger corrective phase. Key resistance is at $61.25, the Oct 24 high. A resumption of the downtrend would open $53.77, a Fibonacci projection.
GOLD TECHS: Trend Signals Point North
- RES 4: $4600.00 - Round number resistance
- RES 3: $4578.3 - 1.618 proj of the Oct 28 - Nov 13 - Nov 18 swing
- RES 2: $4549.9 - High Dec 26 and the bull trigger
- RES 1: $4500.5 - High Jan 7
- PRICE: $4472.5 @ 07:22 GMT Jan 9
- SUP 1: $4274.7 - Low Dec 31
- SUP 2: $4225.3 - 50-day EMA
- SUP 3: $4109.7 - Low Nov 25
- SUP 4: $3998.1 - Low Nov 18
The trend structure in Gold is unchanged, it remains bullish and a sharp sell-off late December appears to have been a correction The trend is overbought and any deeper retracement would allow this condition to unwind. First support at $4372.9, the 20-day EMA, has been pierced. A clear break of the average would expose the 50-day EMA at $4225.3. For bulls, a resumption of gains would open $4235.2, a Fibonacci projection.
SILVER TECHS: Trend Direction Remains Up
- RES 4: $87.355 - 4.382 proj of the Oct 28 - Nov 13 - 21 price swing
- RES 3: $86.065 - 4.236 proj of the Oct 28 - Nov 13 - 21 price swing
- RES 2: $84.008 - High Dec 29 and the bull trigger
- RES 1: $82.754 - High Jan 7
- PRICE: $77.661 @ 08:11 GMT Jan 9
- SUP 1: $71.269 - 20-day EMA
- SUP 2: $62.964 - 50-day EMA
- SUP 3: $56.496 - Low Dec 4
- SUP 4: $50.000 - Round number support
Trend signals in Silver remain bullish and the volatile session late December that resulted in a sharp pullback, appears to have been a correction. Note that the trend is overbought and a deeper retracement would allow this condition to unwind. The first important support to watch lies at $71.269, the 20-day EMA. On the upside, the bull trigger is at $84.008, the Dec 29 high. Clearance of this level would confirm a resumption of the uptrend.


