MNI DAILY TECHNICAL ANALYSIS - Flag Formation in EStoxx50
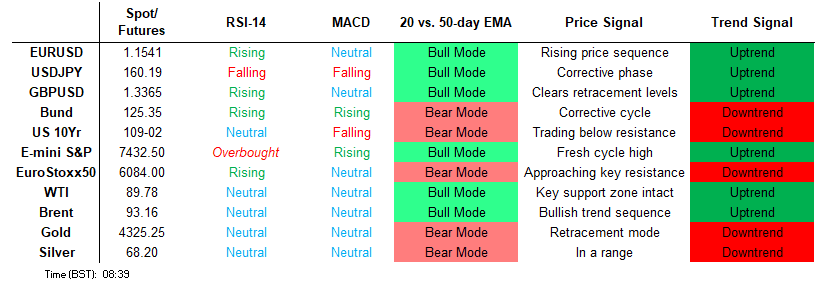
Price Signal Summary - Flag Formation in EStoxx50
- The trend in S&P E-Minis is bullish and short-term pullback’s appear corrective. Friday’s move down resulted in the break of an important short-term support at 7467.60, the 20-day EMA. Trend signals in EUROSTOXX 50 futures are pointing north, highlighted by moving average studies that remain in a bull-mode position.
- Key short-term support in GBPUSD at 1.3303, the May 18 low, remains exposed. Clearance of this price point would strengthen a bearish threat and pave the way for an extension towards 1.3277. The short-term trend needle in EURJPY continues to point north and recent gains appear corrective for now. Moving average studies are in a bull-mode position, highlighting a dominant uptrend. The current uptrend in USDCAD remains intact and recent strong gains have reinforced this condition. The move higher has confirmed a resumption of the bull cycle that started on May 1.
- The trend condition in WTI futures is unchanged, it remains bullish and recent weakness appears corrective. A key area of support to watch is $90.59, the 50-day EMA. A bear theme in Gold remains intact - moving average studies are in a bearish mode position, and this continues to highlight a dominant downtrend. A sharp sell-off on Friday reinforces this condition and signals scope for an extension
- The short-term trend in Bund futures remains bullish and the latest pullback appears - for now - corrective. Key near-term resistance has been defined at 126.63, the May 29 high. A short-term bull cycle in Gilt futures remains intact and recent gains have reinforced this bull theme. Note too that the latest pause appears to be a flag formation - a bullish continuation signal.
FOREIGN EXCHANGE
EURUSD TECHS: Bearish Trend Cycle
- RES 4: 1.1797 High May 06
- RES 3: 1.1701 Top of a bear channel drawn from the Apr 17 high
- RES 2: 1.1654/1686 50-day EMA / High May 29
- RES 1: 1.1576 Low May 21
- PRICE: 1.1543 @ 06:11 BST Jun 9
- SUP 1: 1.1500 Low Jun 08
- SUP 2: 1.1443 Low Mar 30
- SUP 3: 1.1411 Low Mar 13 and 16 and a key M/T support
- SUP 4: 1.1373 1.764 proj of the Jan 27 - Feb 6 - 10 price swing
A bear threat in EURUSD remains present. Last week’s move down confirmed a resumption of the downtrend and the pair is trading closer to its recent lows. A channel base at 1.1537, has been breached. The channel is drawn from 1.1849, the Apr 17 high. This paves the way for an extension towards the next key support at 1.1411, the Mar 13 and 16 low. Resistance to watch is 1.1654, the 50-day EMA, and 1.1686, the May 29 high.
GBPUSD TECHS: Support Remains Exposed
- RES 4: 1.3658 High May 1 and a key resistance
- RES 3: 1.3574 76.4% retracement of the May 1 - 18 bear leg
- RES 2: 1.3522 61.8% retracement of the May 1 - 18 bear leg
- RES 1: 1.3435/1.3509 20-day EMA / High May 26
- PRICE: 1.3358 @ 06:24 BST Jun 9
- SUP 1: 1.3303 Low May 18 and the bear trigger
- SUP 2: 1.3277 76.4% retracement of the Mar 31 - May 1 bull leg
- SUP 3: 1.3212 Low Apr 7
- SUP 4: 1.3159 Low Mar 31 and a key support
Key short-term support in GBPUSD at 1.3303, the May 18 low, remains exposed. Clearance of this price point would strengthen a bearish threat and pave the way for an extension towards 1.3277, the 76.4% retracement of the Mar 31 - May 1 bull leg. Clearance of this level would strengthen a bearish theme and open 1.3159, the Mar 31 low. Key short-term resistance is at 1.3509, the May 26 high.
EURGBP TECHS: Bear Threat Remains Present
- RES 4: 0.8747 76.4% retracement of the Feb 27 - Mar 16 bear leg
- RES 3: 0.8742 High Mar 31 and Apr 1 and a bull trigger
- RES 2: 0.8731 High May 18
- RES 1: 0.8664/82 50-day EMA / High May 29
- PRICE: 0.8640 @ 06:46 BST Jun 9
- SUP 1: 0.8618 Low May 25
- SUP 2: 0.8610 Low Mar 16 and the bear trigger
- SUP 3: 0.8597 Low Aug 14 ‘25
- SUP 4: 0.8576 Low Jul 2 ‘25
EURGBP is unchanged. Trend signals are bearish and S/T gains are considered corrective. Attention is on key support at 0.8610, the Mar 16 low. Clearance of this level would highlight an important medium-term bearish breakout. On the upside, key resistance to watch is 0.8742, the Mar 31 and Apr 1 high. Initial firm resistance is 0.8664, the 50-day EMA, recently pierced. A clear break of the average would be a short-term bullish development.
USDJPY TECHS: Approaching Key Resistance
- RES 4: 161.46 1.618 proj of the Jan 27 - Feb - 12 price swing
- RES 3: 161.00 round number resistance
- RES 2: 160.72 High Apr 30 and the bull trigger
- RES 1: 160.39 High Jun 08
- PRICE: 160.15 @ 06:59 BST Jun 9
- SUP 1: 159.35 20-day EMA
- SUP 2: 158.78/157.32 50-day EMA / Low May 14
- SUP 3: 156.78 Low May 12
- SUP 4: 156.35 Uptrendline drawn off Apr’ 25 low
A bull cycle in USDJPY remains in play for now. The pair is approaching key resistance at 160.72, the Apr 30 high. A clear break of this hurdle would strengthen the uptrend. Note that a breach would also cancel a bear threat highlighted by the large bear candle on Apr 30. While price trades between the Apr 30 open and close (the candle body), it is possible that the recovery since May 6 is corrective. Initial firm support is 158.78, the 50-day EMA.
EURJPY TECHS: Pullback Appears Corrective
- RES 4: 187.95 High Apr 17 and the bull trigger
- RES 3: 187.56 High Apr 30
- RES 2: 186.56 76.4% retracement of the Apr 17 - May 6 bear leg
- RES 1: 186.21 High Jun 5
- PRICE: 184.85 @ 07:03 BST Jun 9
- SUP 1: 184.01 Low Jun 8
- SUP 2: 183.50 Low May 07
- SUP 3: 182.05 Low May 06 and a bear trigger
- SUP 4: 181.87 Low Mar 16
The short-term trend needle in EURJPY continues to point north and recent gains appear corrective for now. Moving average studies are in a bull-mode position, highlighting a dominant uptrend. A resumption of gains would open 186.56, a Fibonacci retracement. Key support lies at 182.05, the May 6 low. Clearance of this level would highlight an important bearish development. Initial firm support to watch is 184.01, Monday’s low.
AUDUSD TECHS: Trading At Its Recent Lows
- RES 4: 0.7402 Top of a bull channel drawn from the Apr 9 ‘25 low
- RES 3: 0.7325 1.500 proj of the Apr 29 - May 1 - May 5 price swing
- RES 2: 0.7223/78 High May 15 / 6 and the bull trigger
- RES 1: 0.7140/7201 20-day EMA / High May 29
- PRICE: 0.7054 @ 08:15 BST Jun 9
- SUP 1: 0.7018 Low Jun 08
- SUP 2: 0.7003 61.8% retracement of the Mar 30 - May 6 bull leg
- SUP 3: 0.6986 Low Apr 13
- SUP 4: 0.6938 76.4% retracement of the Mar 30 - May 6 bull leg
AUDUSD is trading at its recent lows. A sharp sell-off on Friday highlights a clear break of the 50-day EMA, currently at 0.7122. The break of this average signals scope for a deeper retracement and exposes 0.7003, a Fibonacci retracement. Note that the bear cycle that started Jun 5 could still be a correction. MA studies are in a bull-mode position highlighting a dominant uptrend. Initial firm resistance has been defined at 0.7201, the May 29 high.
USDCAD TECHS: Sights Are On Key Resistance
- RES 4: 1.4015 High Dec 2 2025
- RES 3: 1.3972 1.0% 10-dma envelope
- RES 2: 1.3967 High Mar 31 and a key M/T resistance
- RES 1: 1.3961 High Jun 8
- PRICE: 1.3939 @ 08:19 BST Jun 9
- SUP 1: 1.3867 Low Jun 5
- SUP 2: 1.3822 20-day EMA
- SUP 3: 1.3772 50-day EMA
- SUP 4: 1.3731 Low May 20
The current uptrend in USDCAD remains intact and recent strong gains have reinforced this condition. The move higher has confirmed a resumption of the bull cycle that started on May 1. This paves the way for an extension towards 1.3967, the Mar 31 high and the next key resistance. Initial firm support to watch lies at 1.3772, the 50-day EMA. A clear break of this average is required to signal a possible reversal.
FIXED INCOME
BUND TECHS: (U6) Short-Term Corrective Pullback
- RES 4: 127.22 High Mar 10
- RES 3: 127.00 Round number resistance
- RES 2: 126.63 High May 29 and the bull trigger
- RES 1: 126.11 High Jun 3
- PRICE: 125.22 @ 05:46 BST Jun 9
- SUP 1: 124.86 61.8% retracement of the May 18 - 29 rally
- SUP 2: 124.65 Low May 21
- SUP 3: 123.93 Low May 20
- SUP 4: 123.77 Low May 18 and the bear trigger
The short-term trend in Bund futures remains bullish and the latest pullback appears - for now - corrective. Key near-term resistance has been defined at 126.63, the May 29 high. A resumption of gains and a breach of this hurdle would open the 127.00 handle ahead of 127.22, the Mar 10 high. Note that the medium-term trend remains down - moving average studies remain in a bear mode position. Initial support is 124.86, a retracement level.
BOBL TECHS: (U6) Remains In Retracement Mode
- RES 4: 115.500 Round number resistance
- RES 3: 115.180 High May 29 and the bull trigger
- RES 2: 115.020 High Jun 2 High Apr 8 and a key resistance
- RES 1: 114.830 High Jun 3
- PRICE: 114.350 @ 06:00 BST Jun 9
- SUP 1: 114.290 61.8% retracement of the May 19 - 29 rally
- SUP 2: 114.150 Low May 21
- SUP 3: 113.840 Low May 20
- SUP 4: 113.740 Low May 19 and the bear trigger
Bobl futures continue to trade below their recent highs. For now, a S/T bull cycle is intact. A resumption of gains would highlight a continuation of the bullish corrective cycle that started on May 19. The key short-term resistance and bull trigger has been defined at 115.180, the May 29 high. Clearance of this hurdle would open 115.500 next. Initial support lies at 114.290 (pierced), a Fibonacci retracement. The bear trigger is 113.740, May 19 low.
SCHATZ TECHS: (U6) Trading Below Its Recent Highs
- RES 4: 106.000 Round number resistance
- RES 3: 105.950 High May 29 and the bull trigger
- RES 2: 105.855 High Jun 2
- RES 1: 105.755 High Jun 3
- PRICE: 105.605 @ 06:11 BST Jun 9
- SUP 1: 105.540 Low May 8
- SUP 2: 105.440 Low May 19 and the bear trigger
- SUP 3: 105.400 Round number support
- SUP 4: 105.355 2.00 proj of the May 29 - Jun 1 - 2 price swing
The primary trend structure in Schatz futures is unchanged, it remains bearish and - for now - recent gains appear to have been corrective. The pullback from its latest highs has defined a key short-term resistance at 105.950, the May 29 high. A break of this hurdle is required to signal a continuation of the corrective cycle and this would open 106.000 initially. Key support and the bear trigger lies at 105.440, the May 19 low.
GILT TECHS: (U6) Still Looking For Gains
- RES 4: 90.00 Round number resistance
- RES 3: 89.32 3.000 proj of the May 15 - 19 (low-high-low) price swing
- RES 2: 89.02 2.764 proj of the May 15 - 19 (low-high-low) price swing
- RES 1: 88.65/98 High Jun 2 / High May 28
- PRICE: 87.51 @ Close Jun 8
- SUP 1: 87.28 Low Jun 8
- SUP 2: 86.70 Low May 21
- SUP 3: 86.00 Low May 20
- SUP 4: 84.98 Low May 15 and the bear trigger
A short-term bull cycle in Gilt futures remains intact and recent gains have reinforced this bull theme. Note too that the latest pause appears to be a flag formation - a bullish continuation signal. The contract has traded through resistance at 88.08, the May 8 high. This signals scope for a climb towards 89.02, a Fibonacci projection. Initial firm support lies at 86.70, the May 21 low.
BTP TECHS: (U6) Monitoring Support
- RES 4: 119.00 Round number resistance
- RES 3: 118.83 High May 29 and a bull trigger
- RES 2: 118.58 High Jun 2
- RES 1: 118.11 High Jun 3
- PRICE: 117.10 @ Close Jun 8
- SUP 1: 116.90 Low Jun 8
- SUP 2: 116.09 Low May 20
- SUP 3: 115.68 Low May 18 and a key short-term support
- SUP 4: 115.19 Low Apr 7
Medium-term trend conditions in BTP futures remain bearish and recent gains appear corrective - for now. However, a short-term bull cycle is in play, signalling scope for a continuation higher. A resumption of gains would signal scope for a climb towards the 119.00 handle next. Initial key support to watch lies at 115.68, the May 18 low. Clearance of this level would highlight an important short-term bearish development.
EQUITIES
EUROSTOXX50 TECHS: (M6) Bull Flag
- RES 4: 6276.00 1.500 proj of the May 4 - 6 - 18 price swing
- RES 3: 6231.02 0.764 proj of the Mar 23 - Apr 17 - May 4 price swing
- RES 2: 6200.00 Round number resistance
- RES 1: 6153.00 High May 25 and the bull trigger
- PRICE: 6067.00 @ 06:27 BST Jun 9
- SUP 1: 5922.78 50-day EMA
- SUP 2: 5684.00 Low May 4
- SUP 3: 5525.00 Low Apr 2
- SUP 4: 5404.00 Low Mar 31
Trend signals in EUROSTOXX 50 futures are pointing north, highlighted by moving average studies that remain in a bull-mode position. The recent pause appears to be a flag formation - a bullish continuation pattern. A resumption of gains would pave the way for a climb towards 6200.00 next. Firm support lies at 5922.78, the 50-day EMA. A clear break of the average would undermine the bull theme.
E-MINI S&P: (M6) Pullback Considered Corrective
- RES 4: 7652.24 3.618 proj of the Apr 23 - 28 - 29 price swing
- RES 3: 7632.25 High Jun 1
- RES 2: 7591.00 Hugh Jun 5
- RES 1: 7467.60 20-day EMA
- PRICE: 7438.00 @ 07:26 BST Jun 9
- SUP 1: 7355.50 Low Jun 8
- SUP 2: 7285.93 50-day EMA
- SUP 3: 7200.00 Round number support
- SUP 4: 7131.25 Low Apr 29
The trend in S&P E-Minis is bullish and short-term pullback’s appear corrective. Friday’s move down resulted in the break of an important short-term support at 7467.60, the 20-day EMA. The clear breach of this average suggests scope for a deeper short-term retracement towards 7285.93, the 50-day EMA. Note that the 50-day EMA is considered a key support. Key resistance and the bull trigger is 7632.25, the Jun 1 high.
COMMODITIES
BRENT TECHS: (Q6) Bullish Trend Condition Intact
- RES 4: $120.00 - Round number resistance
- RES 3: $115.16 - 1.382 proj of the Mar 10 - 23 - Apr 17 price swing
- RES 2: $111.60 - 1.236 proj of the Mar 10 - 23 - Apr 17 price swing
- RES 1: $102.77/108.34 - High May 22 / 5 and a bull trigger
- PRICE: $92.98 @ 07:05 BST Jun 9
- SUP 1: $89.93 - Low May 29
- SUP 2: $81.45 - Low Apr 17 and a key support
- SUP 3: $75.06 - Low Mar 10
- SUP 4: $67.87 - Low Feb 26
The primary trend set-up in Brent futures remains bullish and short-term weakness - for now - appears corrective. A support area to watch lies at $94.07, the 50-day EMA. The contract has traded through the average, a clear break of it is required to strengthen a bear threat and this would expose $81.45, the Apr 17 low. Key resistance and the bull trigger is $108.34, the May 5 high. Clearance of this hurdle would resume the primary uptrend.
WTI TECHS: (N6) Testing Support
- RES 4: $112.69 - 1.000 proj of the Apr 17 - 30 - May 6 price swing
- RES 3: $110.00 - Round number resistance
- RES 2: $106.42 - 0.764 proj of the Apr 17 - 30 - May 6 price swing
- RES 1: $99.43/105-21 - High May 22 / 18 and the bull trigger
- PRICE: $89.92 @ 07:16 BST Jun 9
- SUP 1: $86.13 - Low May 6
- SUP 2: $77.22 - Low Apr 17 and a key support
- SUP 3: $71.64 - Low Mar 10
- SUP 4: $67.76 - Low Mar 2
The trend condition in WTI futures is unchanged, it remains bullish and recent weakness appears corrective. A key area of support to watch is $90.59, the 50-day EMA. The contract has traded through it, a clear breach is required to highlight a top and the start of a stronger correction. This would open $77.22, the Apr 17 low. For bulls, key resistance has been defined at $105.21, the May 18 high. Clearance of this hurdle would resume the primary uptrend.
GOLD TECHS: Bearish Theme
- RES 4: $4914.9 - 61.8% retracement of the Mar 2 - 23 bear leg
- RES 3: $4773.5/4889.4 - High May 12 / High Apr 16 and a bull trigger
- RES 2: $4601.5 - 50-day EMA
- RES 1: $4501.0 - 20-day EMA
- PRICE: $4344.2 @ 07:22 BST Jun 9
- SUP 1: $4268.8 - Low Jun 8
- SUP 2: $4200.0 - Round number support
- SUP 3: $4099.2 - Low Mar 23 and the bear trigger
- SUP 4: $4000.0 - Psychological round number
A bear theme in Gold remains intact - moving average studies are in a bearish mode position, and this continues to highlight a dominant downtrend. A sharp sell-off on Friday reinforces this condition and signals scope for an extension towards the next key support at $4099.2, the Mar 23 low. A clear break of this level would highlight an important medium-term bearish development. Initial resistance is seen at $4501.0, the 20-day EMA.
SILVER TECHS: Break Lower Exposes Key Support
- RES 4: $100.000 - Round number resistance
- RES 3: $98.487 - 61.8% retracement of the Jan 29 - Mar 23 sell-off
- RES 2: $78.898/89.374 - High May 19 / 13
- RES 1: $76.190 50-day EMA
- PRICE: $68.215 @ 08:22 BST Jun 9
- SUP 1: $61.007 - Low Mar 23 and bear trigger
- SUP 2: $60.000 - Round number support
- SUP 3: $56.496 - Low Dec 4 ‘25
- SUP 4: $53.345 - Low Nov 28 ‘25
A bearish theme in Silver remains intact and last Friday’s sell-off reinforces this theme. The move down resulted in the breach of support $70.869, the Apr 29 low. Clearance of this support exposes $61.007, the Mar 23 low and a bear trigger. A breach of this price point would highlight an important bearish development. Key short-term resistance has been defined at $89.374, the May 13 high. Initial firm resistance is at $76.190, the 50-day EMA.


