MNI DAILY TECHNICAL ANALYSIS - EURGBP Bull Cycle Intact
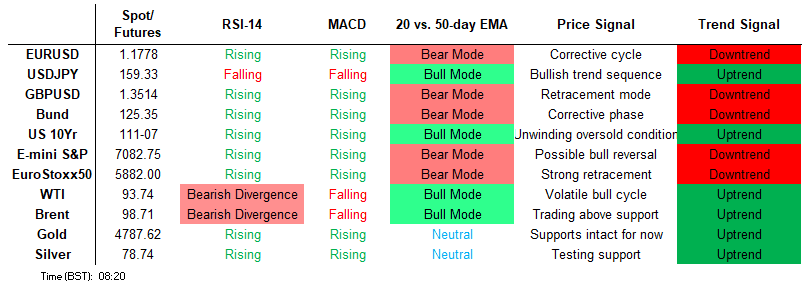
Price Signal Summary - EURGBP Bull Cycle Intact
- A continuation of the strong rally in S&P E-Minis this week, reinforces the bull theme and confirms an extension of the reversal that started Mar 31. EUROSTOXX 50 futures remain in a bull cycle for now. The contract has recently traded through both the 20- and 50-day EMAs, paving the way for a climb towards 5945.47, a Fibonacci retracement point.
- A fresh S/T cycle high in EURUSD early Thursday reinforces the current bull theme and confirms once again an extension of a corrective cycle that started mid-March. Despite the latest pullback, a bull cycle in EURGBP remains intact. Price action since early April still appears to be a flag formation. If correct, this is a bullish continuation pattern and reinforces current short-term conditions. A bullish theme in AUDUSD firmed Thursday as spot rose through the bull trigger to hit a new cycle high. The setup in the 20- and 50-day EMAs is bullish, and continues to highlight a dominant uptrend.
- The medium-term trend set-up in Brent futures is unchanged, it remains bullish and for now, the latest pullback is considered corrective. A key support zone to monitor is the area between $98.14 (pierced) and $89.72. A bear cycle in Silver remains intact and gains are considered corrective. The recent breach of $64.098, the Feb 6 low and bear trigger, reinforces a bear theme.
- The trend structure in Bund futures remains bearish and the move down from the Apr 8 high reinforces this bear theme. Furthermore, MA studies are in a bear-mode position, highlighting a dominant downtrend. Recent gains in Gilt futures appear to have been corrective. Moving average studies are in a bear-mode position, highlighting a dominant downtrend. The initial key short-term support to watch lies at 87.59, the Apr 7 low.
GLOBAL: MNI Global Tech Trend Monitor - March 2026 Update
Full document here: Hidden PDF
- We update our Global Tech Trend Monitor to incorporate sharp swings in asset prices since the onset of the Iran War
- Notably, while the short-term trend in WTI crude futures is up, markets have rarely been able to sustain a breach above a multi-decade range
- AUDJPY, meanwhile, is on the cusp of a possible major reversal, with the August 1990 high of 122.70 a particular level of note
FOREIGN EXCHANGE
EURUSD TECHS: Testing First Key Resistance
- RES 4: 1.1929 76.4% retracement of the Jan 27 - Mar 13 bear leg
- RES 3: 1.1857 High Feb 18
- RES 2: 1.1825 61.8% retracement of the Jan 27 - Mar 13 bear leg
- RES 1: 1.1824 High Apr 16
- PRICE: 1.1777 @ 07:53 BST Apr 17
- SUP 1: 1.1660/1590 50-day EMA / Low Apr 8
- SUP 2: 1.1505 Low Apr 6 and a key S/T support
- SUP 3: 1.1443/11 Low Mar 30 / Low Mar 13 & 16 and the bear trigger
- SUP 4: 1.1373 1.764 proj of the Jan 27 - Feb 6 - 10 price swing
A fresh S/T cycle high early Thursday reinforces the current bull theme and confirms once again an extension of a corrective cycle that started mid-March. Price has traded through both the 20- and 50-day EMAs and sights are on 1.1825 next, a Fibonacci retracement. Note that trend signals continue to highlight a dominant downtrend. Initial key support to watch lies at 1.1660, the 50-day EMA. A break of it would signal a bear reversal.
GBPUSD TECHS: Bull Phase Still In Play
- RES 4: 1.3814 High Jan 30
- RES 3: 1.3701 76.4% retracement of the Jan 27 - Mar 31 bear leg
- RES 2: 1.3635 High Feb 17
- RES 1: 1.3597 61.8% retracement of the Jan 27 - Mar 31 bear leg
- PRICE: 1.3507 @ 07:56 BST Apr 17
- SUP 1: 1.3412 50-day EMA
- SUP 2: 1.3287/3159 Low Apr 8 / Low Mar 31 and the bear trigger
- SUP 3: 1.3125 Low Nov 26 ‘25
- SUP 4: 1.3038 Low Nov 20 ‘25
A short-term bull cycle in GBPUSD is intact and a fresh cycle high this week reinforces current conditions. Sights are on 1.3597 next, a Fibonacci retracement. Note that medium-term trend signals are bearish - moving average studies are in bear-mode position highlighting a broader dominant downtrend. This continues to suggest that for now, gains are corrective. Initial support to watch is 1.3412, the 50-day EMA. A break of it would be bearish.
EURGBP TECHS: Monitoring Support At The 50-Day EMA
- RES 4: 0.8797 High Dec 17
- RES 3: 0.8789 High Feb 27 and key resistance
- RES 2: 0.8747 76.4% retracement of the Feb 27 - Mar 16 bear leg
- RES 1: 0.8742 High Mar 31 and Apr 1 and the bull trigger
- PRICE: 0.8703 @ 07:58 BST Apr 17
- SUP 1: 0.8694/85 50-day EMA / Low Apr 14
- SUP 2: 0.8637/10 Low Mar 26 / 16 and the bear trigger
- SUP 3: 0.8597 Low Aug 14
- SUP 4: 0.8578 Low Jul 2 ‘25
Despite the latest pullback, a bull cycle in EURGBP remains intact. Price action since early April still appears to be a flag formation. If correct, this is a bullish continuation pattern and reinforces current short-term conditions. Scope is seen for a climb towards 0.8747 next, the 76.4% retracement of the Feb - Mar bear leg. Note that the 50-day EMA, at 0.8694, has been pierced. A clear break of this average would signal scope for a deeper retracement.
USDJPY TECHS: Trend Needle Points North
- RES 4: 161.95 High Jul 3 ‘24 and a major resistance
- RES 3: 161.46 1.618 proj of the Jan 27 - Feb - 12 price swing
- RES 2: 160.79 1.500 proj of the Jan 27 - Feb - 12 price swing
- RES 1: 160.03/160.46 High Apr 7 / High Mar 30 and the bull trigger
- PRICE: 159.36 @ 08:04 BST Apr 17
- SUP 1: 158.49 Low Apr 9
- SUP 2: 158.10 50-day EMA
- SUP 3: 156.46 Low Mar 5
- SUP 4: 155.85 Low Mar 2
The primary trend set-up in USDJPY is unchanged, it remains bullish and the pair continues to trade closer to its recent highs. Moving average studies are in a bull-mode position that highlights a dominant medium-term uptrend. The recovery from last week’s low reinforces current conditions and scope is seen for a climb towards 160.79 next, a Fibonacci projection. Initial firm support to watch lies at 158.10, the 50-day EMA.
EURJPY TECHS: Northbound
- RES 4: 188.81 2.236 proj of the Mar 16 - 27 - 30 price swing
- RES 3: 188.15 2.000 proj of the Mar 16 - 27 - 30 price swing
- RES 2: 188.00 Round number resistance
- RES 1: 187.95 High Apr 17
- PRICE: 187.46 @ 08:06 BST Apr 17
- SUP 1: 185.89 Low Apr 13
- SUP 2: 185.43 20-day EMA
- SUP 3: 184.33 50-day EMA
- SUP 4: 182.59 Low Mar 30
A strong bull cycle in EURJPY remains intact and the cross is building on recent gains. The latest rally has resulted in a breach of resistance at 186.87, the Jan 23 high and a key medium-term hurdle. Clearance of this level confirms a resumption of the uptrend. Note that price remains inside a bull channel drawn from the Feb 28 ‘25 low. Initial firm support to watch is 185.43, the 20-day EMA. Sights are on 188.15, a Fibonacci projection.
AUDUSD TECHS: Hits Bull Trigger
- RES 4: 0.7300 Top of a bull channel drawn from the Apr 9 ‘25 low
- RES 3: 0.7292 3.0% Upper Bollinger Band
- RES 2: 0.7200 Round number resistance
- RES 1: 0.7197 High Apr 16 & 1.0% 10-dma envelope
- PRICE: 0.7187 @ 16:46 BST Apr 16
- SUP 1: 0.6996 50-day EMA
- SUP 2: 0.6876 Low Apr 6
- SUP 3: 0.6833 Low Mar 30 and a key support
- SUP 4: 0.6740 Trendline support drawn from the Apr 9 ‘25 low
A bullish theme in AUDUSD firmed Thursday as spot rose through the bull trigger to hit a new cycle high. The setup in the 20- and 50-day EMAs is bullish, and continues to highlight a dominant uptrend. 0.7103, the 76.4% retracement of the Mar 11 - 30 bear leg, has been cleared, as well as the bull trigger into 0.7187, the Mar 11 high. First support to watch lies at 0.6996, the 50-day EMA. A clear break of it would undermine the bull theme.
USDCAD TECHS: Breaches The 50-Day EMA
- RES 4: 1.4051 High Nov 28
- RES 3: 1.4015 High Dec 2 ‘25
- RES 2: 1.3985 76.4% retracement of the Nov 5 ‘25 - Jan 30 bear leg
- RES 1: 1.3878/3967 High Apr 13 / High Mar 31 and the bull trigger
- PRICE: 1.3689 @ 08:13 BST Apr 17
- SUP 1: 1.3707 Low Apr 16
- SUP 2: 1.3694 61.8% retracement of the Mar 9 - 31 bull leg
- SUP 3: 1.3670 Low Mar 23
- SUP 4: 1.3630 76.4% retracement of the Mar 9 - 31 bull leg
A S/T bear cycle in USDCAD remains intact, and prices have followed through on Thursday. While MA studies are in a bull-mode position, the clear break of the 50-day average highlights a stronger S/T bear threat and has opened 1.3694, the 61.8% retracement of the Mar 9 - 31 bull leg. For bulls, a reversal higher would refocus attention on 1.3967, the Mar 31 high and bull trigger.
FIXED INCOME
BUND TECHS: (M6) Trend Theme Remains Bearish
- RES 4: 127.51 61.8% retracement of the Mar 2 - 27 bear leg
- RES 3: 127.20 High Mar 11
- RES 2: 126.85 High Mar 18
- RES 1: 125.59/126.64 20-day EMA / High Apr 8 and key resistance
- PRICE: 125.21 @ 07:21 BST Apr 17
- SUP 1: 124.25 Low Mar 27 and the bear trigger
- SUP 2: 124.00 Round number support
- SUP 3: 123.86 1.618 proj of the Mar 10 - 13 - 18 price swing
- SUP 4: 123.59 1.764 proj of the Mar 10 - 13 - 18 price swing
The trend structure in Bund futures remains bearish and the move down from the Apr 8 high reinforces this bear theme. Furthermore, MA studies are in a bear-mode position, highlighting a dominant downtrend. The focus is on key short-term support and the bear trigger at 124.25, the Mar 27 low. A break of this level would confirm a resumption of the downtrend and open the 124.00 handle. Key resistance has been defined at 126.64, the Apr 8 high.
BOBL TECHS: (M6) Trend Outlook Stabilising
- RES 4: 116.925 61.8% retracement of the Mar 2 - 27 bear leg
- RES 3: 116.770 High Mar 11
- RES 2: 116.500 50.0% retracement of the Mar 2 - 27 bear leg
- RES 1: 116.240 High Apr 8 and the bull trigger
- PRICE: 115.570 @ 07:23 BST Apr 17
- SUP 1: 114.950/114.700 Low Apr 7 / Low Mar 27 and the bear trigger
- SUP 2: 114.630 2.000 proj of the Mar 2 - 3 - 4 price swing
- SUP 3: 114.295 2.236 proj of the Mar 2 - 3 - 4 price swing
- SUP 4: 114.000 Round number support
The bearish trend condition in Bobl futures continues to moderate, with prices pricing four consecutive sessions of higher highs and higher lows. Nonetheless, S/T strength is seen as corrective up to 116.500, a Fibonacci retracement point. Note that the latest recovery has allowed an oversold trend condition to unwind. Key support and the bear trigger has been defined at 114.700, the Mar 27 low. Clearance of this level would resume the downtrend.
SCHATZ TECHS: (M6) Gains Continue to be Considered Corrective
- RES 4: 106.575 High Mar 10
- RES 3: 106.433 61.8% retracement of the Mar 2 - 23 bear leg
- RES 2: 106.245 50.0% retracement of the Mar 2 - 23 bear leg
- RES 1: 106.120 High Mar 8 and the bull trigger
- PRICE: 105.930 @ 07:25 BST Apr 17
- SUP 1: 105.710/450 Low Apr 13 / Low Mar 23 and the bear trigger
- SUP 2: 105.433 2.500 proj of the Mar 2 - 3 - 4 price swing
- SUP 3: 105.400 Round number support
- SUP 4: 105.371 2.618 projection of the Mar 2 - 3 - 4 price swing
A primary bear cycle in Schatz futures remains intact and recent gains appear corrective. A resumption of short-term gains would signal scope for an extension towards 106.245, a Fibonacci retracement point. Moving average studies are in a bear-mode position highlighting a dominant downtrend. The bear trigger has been defined at 105.450, the Mar 23 low. Clearance of this level would confirm a resumption of the bear leg.
GILT TECHS: (M6) MA Studies Highlight A Dominant Downtrend
- RES 4: 91.52 High Mar 10
- RES 3: 91.00 Round number resistance
- RES 2: 90.74 50.0% retracement of the Feb 27 - Mar 23 bear leg
- RES 1: 90.21 High Apr 9 and the bull trigger
- PRICE: 88.25 @ Close Apr 16
- SUP 1: 87.82 Low Apr 13
- SUP 2: 87.59 Low Apr 7 and a key near-term support
- SUP 3: 87.13 Low Mar 30
- SUP 4: 85.91 Low MAr 23 and a key support
Recent gains in Gilt futures appear to have been corrective. Moving average studies are in a bear-mode position, highlighting a dominant downtrend. The initial key short-term support to watch lies at 87.59, the Apr 7 low. Clearance of this level would be a bearish development and mark the end of the corrective cycle. For bull, a resumption of gains would instead open 90.74 next, a Fibonacci retracement, ahead of 91.00.
BTP TECHS: (M6) Trading Below Its Recent Highs
- RES 4: 122.04 High Feb 27 and key resistance
- RES 3: 120.98 High Mar 3
- RES 2: 120.22 76.4% retracement of the Feb 27 -Mar 27 bear cycle
- RES 1: 118.03/119.09 High Apr 9/ 61.8% of Feb 27 - Mar 27 bear leg
- PRICE: 117.23 @ 07:27 BST Apr 16
- SUP 1: 116.48 Low Apr 13
- SUP 2: 115.58 Low Apr 7
- SUP 3: 114.32 Low Mar 27 and the bear trigger
- SUP 4: 114.00 Round number support
Recent gains in BTP futures highlight a stronger corrective cycle. A resumption of the upleg would signal scope for a test of 119.09, 61.8% of the bear leg between Feb 27 - Mar 27. Clearance of this level would open 120.22, the 76.4% retracement. The contract has pulled back from last week’s high. A clear reversal would highlight the end of the corrective phase and refocus attention on key support at 114.32, the Mar 27 low.
EQUITIES
EUROSTOXX50 TECHS: (M6) Within Range of Highs
- RES 4: 61430.00 High Feb 26 and a key resistance
- RES 3: 6015.00 High Mar 2
- RES 2: 5945.47 76.4% retracement of the Feb 26 - Mar 23 bear leg
- RES 1: 5934.00 High Apr 14
- PRICE: 5861.00 @ 07:30 BST Apr 17
- SUP 1: 5753.53 50-day EMA
- SUP 2: 5525.00 Low Apr 2 and a key short-term support
- SUP 3: 5341.00 Low Mar 30
- SUP 4: 5306.00 Low Mar 23 and the bear trigger
EUROSTOXX 50 futures remain in a bull cycle for now. The contract has recently traded through both the 20- and 50-day EMAs, paving the way for a climb towards 5945.47, a Fibonacci retracement point. Note that a break of 5945.47 would expose the key resistance and bull trigger at 6143.00, the Feb 26 high. Key support to watch lies at 5525.00, the Apr 2 low. A breach of this support would highlight a reversal. First support is 5753.53, the 50-day EMA.
E-MINI S&P: (M6) Rally Extends
- RES 4: 7262.64 123.6% projection for Mar 31 - Apr 16 upleg
- RES 3: 7106.25 3.0% 10-dma envelope
- RES 2: 7096.50 High Jan 28 and the medium-term bull trigger
- RES 1: 7089.00 High Apr 16
- PRICE: 7078.50 @ 07:33 BST Apr 17
- SUP 1: 6920.25/6767.00 Low Apr 14 / 13 and a key near-term support
- SUP 2: 6807.76 20-day EMA
- SUP 3: 6652.25 Low Apr 8
- SUP 4: 6567.00/6503.75 Low Apr 6 and key S/T support / Low Apr 2
A continuation of the strong rally in S&P E-Minis this week, reinforces the bull theme and confirms an extension of the reversal that started Mar 31. Medium-term trend signals have begun to flatten out - negating the bearish moving average themes that dominated through March. The bull trigger remains 7096.50, the Jan 28 high. Initial key support to watch lies at 6567.00, the Apr 13 low.
COMMODITIES
BRENT TECHS: (M6) Key Support Intact For Now
- RES 4: $125.19 - High Jun 14 ‘22 (cont) and a key resistance
- RES 3: $121.88 - High Jun 15 ‘22 (cont)
- RES 2: $120.0 8 - 76.4% retracement of the Mar ‘22 - Apr ‘25 Bear leg
- RES 1: $112.12 - High Mar 19 and the bull trigger
- PRICE: $98.61 @ 07:37 BST Apr 17
- SUP 1: $89.72 - 50-day EMA
- SUP 2: $83.96 - Low Mar 11
- SUP 3: $78.97 - Low Mar 10
- SUP 4: $74.54 - Low Mar 2
The medium-term trend set-up in Brent futures is unchanged, it remains bullish and for now, the latest pullback is considered corrective. A key support zone to monitor is the area between $98.14 (pierced) and $89.72, the 20- and 50-day EMAs. A clear break of the 50-day average would signal a short-term reversal and suggest potential for a deeper retracement. Key resistance and the bull trigger has been defined at $112.12, the Mar 19 high.
WTI TECHS: (K6) Tests Key Support
- RES 4: $126.49 - 1.618 proj of the Mar 10 - 23 high-low price swing
- RES 3: $123.68 - High Jun 14 ‘22 (cont) and a key resistance
- RES 2: $120.00 - Psychological round number
- RES 1: $117.63 - High Apr 7 and the bull trigger
- PRICE: $93.50 @ 07:41 BST Apr 17
- SUP 1: $87.43/86.96 - 50-day EMA / Low Apr 15
- SUP 2: $84.37 - Low Mar 23
- SUP 3: $75.64 - Low Mar 10
- SUP 4: $69.00 - Low Mar 2
Recent weakness in WTI futures is considered corrective. The contract has traded through the 20-day EMA, at $97.36. Attention is on support at the 50-day EMA, at $87.43. It has been tested, a clear break of the average is required to highlight a stronger short-term reversal. On the upside key resistance and the bull trigger has been defined at $117.63, the Apr 7 high. Clearance of this hurdle would confirm a resumption of the uptrend.
GOLD TECHS: Short-Term Bull Cycle Remains In Play
- RES 4: $5107.6 - 76.4% retracement of the Mar 2 - 23 bear leg
- RES 3: $5000.0 - Round number resistance
- RES 2: $4914.9 - 61.8% retracement of the Mar 2 - 23 bear leg
- RES 1: $4871.4 - High Apr 16
- PRICE: $4785.6 @ 07:43 BST Apr 17
- SUP 1: $4554.2 - Low Apr 2 and a key short-term support
- SUP 2: $4420.1 - Low Mar 30
- SUP 3: $4306.4 - Low Mar 24
- SUP 4: $4099.2 - Low Mar 23 and the bear trigger
Recent gains in Gold appear to be corrective, however for now, a short-term bull cycle is intact. The metal has pierced the 50-day EMA, at $4782.4. This signals scope for an extension towards $4914.9, a Fibonacci retracement point. Clearance of this level would open the $5000.0 handle. Initial firm support to watch lies at $4554.2, the Apr 2 low. A break of this level would be bearish.
SILVER TECHS: Resistance Gives Way into 50-Day EMA
- RES 4: $107.341 - 76.4% retracement of the Jan 29 - Mar 23 sell-off
- RES 3: $97.804 - High Mar 2
- RES 2: $90.015 - High Mar 10
- RES 1: $84.174 - 38.2% retracement of the Jan 29 - Mar 23 bear leg
- PRICE: $78.653 @ 07:44 BST Apr 17
- SUP 1: $61.007 - Low Mar 23 and the bear trigger
- SUP 2: $60.000 - Round number support
- SUP 3: $56.496 - Low Dec 4 ‘25
- SUP 4: $53.345 - Low Nov 28 ‘25
A bear cycle in Silver remains intact and gains are considered corrective. The recent breach of $64.098, the Feb 6 low and bear trigger, reinforces a bear theme. A clear break of this level would confirm a resumption of the downtrend plus open $60.00 and below. Key resistance is $97.804, the Mar 2 high. Resistance at the 50-day EMA, at $77.427, has been breached. The next resistance to watch is $84.174, a Fibonacci retracement.


