MNI Daily Technical Analysis - EUR Bull Cycle Extends
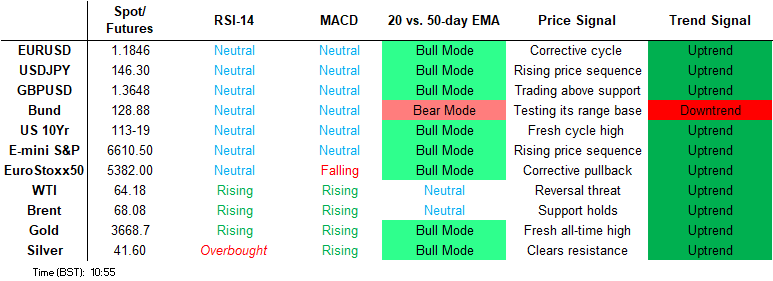
Price Signal Summary - EURUSD Trend Needle Points North
- In the equity space, a bull cycle in S&P E-Minis remains intact and the contract is trading closer to its recent highs. A fresh cycle high yesterday reinforces current bullish conditions. The move higher confirms a resumption of the primary uptrend and maintains the bullish price sequence of higher highs and higher lows. Sights are on the 6700.00 handle next and 6712.33, a 1.764 projection of the Aug 20 - 28 - Sep 2 price swing. Initial support to watch is 6569.89, the 20-day EMA. EUROSTOXX 50 futures have recently traded through the 20-day EMA - a bullish development for now. The move higher undermines a recent bearish theme and signals potential for a climb towards 5522.0, the Aug 26 high and a bull trigger. On the downside, key support has been defined at 5292.00, the Sep 2 low. Clearance of this level is required to reinstate a bearish theme. For now, yesterday’s move down appears corrective.
- In FX, the trend theme in EURUSD remains bullish. Tuesday’s gains resulted in a climb above 1.1829 the Jul 01 high and bull trigger. Clearance of this hurdle confirms a resumption of the primary uptrend and opens 1.1923 next, the 2.00 projection of the Feb 28 - Mar 18 - 247 price swing. Support to watch is the 50-day EMA, at 1.1652. A bullish theme in GBPUSD remains intact and price is trading higher this week. The pair has breached resistance at 1.3595, the Aug 14 high and a bull trigger. The break strengthens bullish conditions and opens 1.3681 next, the Jul 4 high. Initial firm support to watch is 1.3487, the 50-day EMA. Key short-term support to watch in USDJPY is 146.21, the Aug 14 low and a bear trigger. A break of this level would highlight a stronger bearish threat and a range breakout. This would expose 145.40, 50% of the Apr - Aug upleg. On the upside, clearance of 149.14, the Sep 3 high is required to reinstate a bullish theme. Note that moving average studies are in a bull-mode position and this continues to highlight a dominant uptrend.
- On the commodity front, Gold remains in a clear bull cycle and the yellow metal is trading closer to its recent highs. A fresh all-time high, once again this week, confirms a resumption of the primary uptrend and an extension of the sequence of higher highs and higher lows. The next objective is $3705.2, a 1.382 projection of the May 15 - Jun 16 - 30 price swing. Initial firm support lies at $3547.7, the 20-day EMA. In the oil space, the trend condition in WTI futures is unchanged - a bear cycle remains intact and the latest recovery is considered corrective. The pullback from the Sep 2 high highlights a possible recent reversal and the end of a corrective phase between Aug 13 - Sep 2. Initial resistance to watch is $66.03, the Sep 2 high. A stronger resumption of weakness would open $57.71, the May 30 low.
- In the FI space, Bund futures continue to trade below their latest highs. Recent gains have resulted in a break of resistance at 128.87, the Aug 28 high and a short-term bull trigger. The climb undermines a recent bearish theme and highlights a stronger reversal. Scope is seen for an extension towards 129.50, the Aug 5 high. Key support and the bear trigger has been defined at 127.61, the Sep 3 low. The latest pullback is - for now - considered corrective. A bull cycle in Gilt futures remains intact. A recent rally highlights a stronger corrective cycle and the contract is holding on to its gains. Note that the move higher is allowing an oversold trend condition to unwind. Price has breached initial firm resistance at 90.84, the Aug 28 and 29 high. A continuation higher would open 92.06, the Aug 14 high. On the downside, initial support lies at 90.65, the Sep 5 low.
Highlighting Key Longer-Term Trends:
MNI Tech Trend Monitor: Hidden PDF
We introduce the MNI Tech Trend Monitor - This document highlights a selection of key longer-term trends that we have identified in markets that could be reaching inflection points, trend reversals/extensions or technically significant levels.
Covering:
- UK Gilt 10y Yield
- UK Gilt 30y Yield
- ICE USD Index
- Europe Banking Stock Index (SX7E)
FOREIGN EXCHANGE
EURUSD TECHS: Northbound
- RES 4: 1.2063 2.236 proj of the Feb 28 - Mar 18 - 247 price swing
- RES 3: 1.2000 Round number resistance
- RES 2: 1.1923 2.00 proj of the Feb 28 - Mar 18 - 247 price swing
- RES 1: 1.1878 High Sep 16
- PRICE: 1.1859 @ 06:06 BST Sep 17
- SUP 1: 1.1710/52 20- and 50-day EMA values
- SUP 2: 1.1574 Low Aug 27
- SUP 3: 1.1528 Low Aug 5
- SUP 4: 1.1392 Low Aug 1 and bear trigger.
The trend theme in EURUSD remains bullish. Resistance at 1.1743, the Aug 22 high, has recently been cleared reinforcing a bull cycle. Tuesday’s gains have resulted in a climb above 1.1829 the Jul 01 high and bull trigger. Clearance of this hurdle confirms a resumption of the primary uptrend and opens 1.1923 next, a Fibonacci projection. Support to watch is the 50-day EMA, at 1.1652.
GBPUSD TECHS: Recovery Extends
- RES 4: 1.3789 High Jul 1 and key resistance
- RES 3: 1.3753 High Jul 2
- RES 2: 1.3681 High Jul 4
- RES 1: 1.3672 High Sep 16
- PRICE: 1.3647 @ 06:19 BST Sep 17
- SUP 1: 1.3523 20-day EMA
- SUP 2: 1.3487/3430 50-day EMA / Low Sep 5
- SUP 3: 1.1.3333 Low Sep 3
- SUP 4: 1.3142 Low Aug 1 and a key support
A bullish theme in GBPUSD remains intact and price is trading higher this week. The pair has breached resistance at 1.3595, the Aug 14 high and a bull trigger. The break strengthens bullish conditions and opens 1.3681 next, the Jul 4 high. Initial firm support to watch is 1.3487, the 50-day EMA. A clear breach of the EMA would highlight a potential reversal and signal scope for a deeper retracement.
EURGBP TECHS: Bullish Outlook
- RES 4: 0.8769 High Jul 28 and the bull trigger
- RES 3: 0.8744 High Aug 7
- RES 2: 0.8728 76.4% retracement of the Jul 28 - Aug 14 bear leg
- RES 1: 0.8713 High Sep 2
- PRICE: 0.8689 @ 06:31 BST Sep 17
- SUP 1: 0.8640/8597 50-day EMA / Low Aug 14 and the bear trigger
- SUP 2: 0.8562 50.0% retracement May 29 - Jul 28 upleg
- SUP 3: 0.8540 Low Jun 30
- SUP 4: 0.8514 61.8% retracement May 29 - Jul 28 upleg
The latest pullback in EURGBP appears corrective and Tuesday’s rally signals the end of the corrective phase. Support to watch lies at 0.8597, the Aug 14 low. Clearance of this level would cancel a bull theme and reinstate a recent bearish threat. For bulls, a stronger resumption of gains would open 0.8744, the Aug 7 high. Key resistance and the bull trigger is at 0.8769, the Jul 28 high. First support is 0.8640, the 50-day EMA.
USDJPY TECHS: Monitoring Support
- RES 4: 151.62 61.8% retracement of the Jan 10 - Apr 22 bear leg
- RES 3: 150.92 High Aug 1 and a key resistance
- RES 2: 149.81 76.4% retracement of the Aug 1 - 14 bear leg
- RES 1: 148.17/149.14 High Sep 11 / High Sep 3
- PRICE: 146.52 @ 06:54 BST Sep 17
- SUP 1: 146.21 Low Aug 14
- SUP 2: 145.86 Low Jul 24
- SUP 3: 145.80 Trendline drawn from the Apr 22 low
- SUP 4: 145.40 50% retracement of the Apr - Aug upleg
Key short-term support to watch in USDJPY is 146.21, the Aug 14 low and a bear trigger. A break of this level would highlight a stronger bearish threat and highlight a range breakout. This would expose 145.40, a Fibonacci retracement. On the upside, clearance of 149.14, the Sep 3 high is required to reinstate a bullish theme. Note that moving average studies are in a bull-mode position and this continues to highlight a dominant uptrend.
EURJPY TECHS: Trend Structure Remains Bullish
- RES 4: 177.08 2.000 proj of the Feb 28 - Mar 18 - Apr 7 price swing
- RES 3: 175.43 High Jul 11 ‘24 and a key medium-term resistance
- RES 2: 174.86 1.764 proj of the Feb 28 - Mar 18 - Apr 7 price swing
- RES 1: 173.97 High Jul 28 and the bull trigger
- PRICE: 173.66 @ 07:08 BST Sep 17
- SUP 1: 172.67/171.56 20- and 50-day EMA
- SUP 2: 169.73/45 Low Jul 31 / 23.6% of the Feb 28 - Jul 28 bull leg
- SUP 3: 168.46 Low Jul 1
- SUP 4: 167.46 Low Jun 23
The trend set-up in EURJPY is unchanged, it remains bullish and sights are on key resistance and the bull trigger at 173.97, the Jul 28 high. Clearance of this level would confirm a continuation of the bull phase. Moving average studies are in a bull-mode position too, highlighting a primary uptrend. Clearance of 173.97 would open 174.86, a Fibonacci projection. Key support to watch lies at the 50-day EMA at 171.56.
AUDUSD TECHS: Bulls Remain In The Driver’s Seat
- RES 4: 0.6763 1.382 proj of the Jun 23 - Jul 24 - Aug 21 price swing
- RES 3: 0.6726 1.236 proj of the Jun 23 - Jul 24 - Aug 21 price swing
- RES 2: 0.6700 Round number resistance
- RES 1: 0.6690 Intraday high
- PRICE: 0.6673 @ 07:51 BST Sep 17
- SUP 1: 0.6579/6537 20- and 50-day EMA values
- SUP 2: 0.6463/6415 Low Aug 27 / Low Aug 21 / 22 and a bear trigger
- SUP 3: 0.6373 Low Jun 23
- SUP 4: 0.6354 38.2% retracement of the Apr 9 - Jul 24 upleg
AUDUSD bulls remain in the driver’s seat. The latest rally plus the breach of 0.6625, the Jul 24 high and bull trigger, confirm a resumption of the uptrend. The climb opens the 0.6700 handle next. Moving average studies are in a bull-mode position highlighting a dominant uptrend. Key support to watch is 0.6415, the Aug 21 / 22 low. Initial firm support to monitor lies at 0.6579, the 20-day EMA.
USDCAD TECHS: Strong Sell-Off Exposes Support
- RES 4: 1.4019 38.2% retracement of the Feb 3 - Jun 16 bear leg
- RES 3: 1.3925 High Aug 22 and the bull trigger
- RES 2: 1.3890 High Sep 11
- RES 1: 1.3803 20-day EMA
- PRICE: 1.3751 @ 07:56 BST Sep 17
- SUP 1: 1.3727 Low Aug 29 and a bear trigger
- SUP 2: 1.3709 61.8% retracement of the Jul 23 - Aug 22 bull cycle
- SUP 3: 1.3658 76.4% retracement of the Jul 23 - Aug 22 bull cycle
- SUP 4: 1.3637 Low Jul 25
A sharp sell-off in USDCAD this week has resulted in a break of the 20-and-50-day EMAs. This undermines a recent bullish theme and a continuation lower would expose key short-term support at 1.3727, the Aug 27 low. A break of this level would strengthen a bearish threat. For bulls, resistance levels to watch are; 1.3890, the Sep 11 high, and 1.3925, the Aug 22 high and bull trigger.
FIXED INCOME
BUND TECHS: (Z5) Corrective Pullback
- RES 4: 130.27 High Jun 20
- RES 3: 130.05 76.4% retracement of the Jun 13 - Sep 3 bear cycle
- RES 2: 129.66 High Jul 22
- RES 1: 129.09/50 High Sep 12 / High Aug 5 and a key resistance
- PRICE: 128.78 @ 05:41 BST Sep 17
- SUP 1: 128.25 Low Sep 4
- SUP 2: 127.61 Low Sep 3 and the bear trigger
- SUP 3: 127.46 1.00 proj of the Aug 14 - 15 - 28 price swing
- SUP 4: 127.13 1.236 proj of the Aug 14 - 15 - 28 price swing
Bund futures continue to trade below their recent highs. Recent gains have resulted in a break of resistance at 128.87, the Aug 28 high and a short-term bull trigger. The climb undermines a recent bearish theme and highlights a stronger reversal. Scope is seen for an extension towards 129.50, the Aug 5 high. Key support and the bear trigger has been defined at 127.61, the Sep 3 low. The latest pullback is - for now - considered corrective.
BOBL TECHS: (Z5) Support Remains Intact For Now
- RES 4: 118.635 1.500 proj of the Aug 25 - 28 - Sep 2 price swing
- RES 3: 118.561 1.382 proj of the Aug 25 - 28 - Sep 2 price swing
- RES 2: 118.469 1.236 proj of the Aug 25 - 28 - Sep 2 price swing
- RES 1: 118.020/400 High Sep 12 / High Sep 8 and 10
- PRICE: 117.940 @ 05:56 BST Sep 17
- SUP 1: 117.760 Low Sep 4
- SUP 2: 117.690 Low Sep 2
- SUP 3: 117.630 Low Aug 25 and a key short-term support
- SUP 4: 117.481 123.6% retracement projection of Aug 25 - 28 rally
Bobl futures remain below their recent highs. The contract recently breached resistance at 118.260, the Aug 28 high. A break of this level does undermine a recent bearish theme and a resumption of gains would signal scope for a recovery towards 118.469, a Fibonacci projection. On the downside, the latest pullback has exposed support at 117.690, the Sep 2 low. Clearance of this level would reinstate a bearish theme.
SCHATZ TECHS: (Z5) Trend Structure Remains Bearish
- RES 4: 107.240 High Aug 4
- RES 3: 107.225 High Aug 27 and the bull trigger
- RES 2: 107.145/190 High Sep 11 / High Sep 5 and 8
- RES 1: 107.050 Low Aug 25 and Sep 2 and a recent breakout level
- PRICE: 107.015 @ 06:02 BST Sep 17
- SUP 1: 106.965 Low Sep 12
- SUP 2: 106.948 1.382 proj of the the Aug 27 - Sep 2 - 8 price swing
- SUP 3: 106.928 1.500 proj of the the Aug 27 - Sep 2 - 8 price swing
- SUP 4: 106.900 Round number support
The trend structure in Schatz futures is unchanged, it remains bearish and last week’s sell-off confirms a resumption of the downtrend. The contract has breached support at 107.050, the Aug 25 and Sep 2 low plus a bear trigger. This maintains the bearish price sequence of lower lows and lower highs. Scope is seen for an extension towards 106.948 next, a Fibonacci projection. Initial resistance is at 107.050, Aug 25 and Sep 2 low.
GILT TECHS: (Z5) Corrective Bull Cycle Still In Play
- RES 4: 92.30 High Aug 7
- RES 3: 92.06 High Aug 14
- RES 2: 92.00 Round number resistance
- RES 1: 91.82 High Sep 11
- PRICE: 91.39 @ Close Sep 16
- SUP 1: 90.65 Low Sep 2
- SUP 2: 90.31/89.36 Low Sep 4 / 3
- SUP 3: 89.22 1.618 proj of the Aug 21 - 27 - 28 price swing
- SUP 4: 89.00 Round number support
A bull cycle in Gilt futures remains intact. A recent rally highlights a stronger corrective cycle and the contract is holding on to its gains. Note that the move higher is allowing an oversold trend condition to unwind. Price has breached initial firm resistance at 90.84, the Aug 28 and 29 high. A continuation higher would open 92.06, the Aug 14 high. On the downside, initial support lies at 90.65, the Sep 5 low.
BTP TECHS: (Z5) Bull Trigger Remains Exposed
- RES 4: 122.56 0.764 proj of the Apr 9 - May 8 - 14 price swing (cont)
- RES 3: 121.88 0.618 proj of the Apr 9 - May 8 - 14 price swing (cont)
- RES 2: 121.00 Round number resistance
- RES 1: 120.74 High Aug 5 and the bull trigger
- PRICE: 120.17 @ Close Sep 16
- SUP 1: 119.06/118.36 Low Sep 4 / 3
- SUP 2: 118.00 Round number support
- SUP 3: 117.70 2.236 proj of the Aug 5 - 12 - 14 price swing
- SUP 4: 117.36 2.500 proj of the Aug 5 - 12 - 14 price swing
The primary trend condition in BTP futures is unchanged, it remains bullish. The strong rally that started Sep 3 reinforces this theme and signals the end of the recent corrective pullback between Aug 5 - Sep 3. Key resistance and the bull trigger is 120.74, the Aug 5 high. A break of this hurdle would confirm a resumption of the uptrend. Key support has been defined at 118.36, the Sep 3 low.
US 10YR FUTURE TECHS: (Z5) Bullish Trend Sequence Intact
- RES 4: 114-10 High Apr 7 (cont.)
- RES 3: 114-10 1.0% 10-dma envelope / High Apr 7 (cont.)
- RES 2: 114-00 Round number resistance
- RES 1: 113-29 High Sep 5
- PRICE: 113-17+ @ 20:03 BST Sep 16
- SUP 1: 112-25+ 20-day EMA
- SUP 2: 112-04 50-day EMA
- SUP 3: 111-13+ Low Aug 18 and a key support
- SUP 4: 110-25 Low Aug 1
Treasury futures remain in a bull-mode condition. Note that the recent impulsive rally signalled an acceleration of the uptrend. Also, moving average studies are in a bull-mode position, highlighting a dominant uptrend. This suggests scope for an extension through 114-00 next and a test of 114-10, the Apr 7 high (cont). Initial firm support to watch is 112-25+, the 20-day EMA.
EQUITIES
EUROSTOXX50 TECHS: (U5) Pullback Appears Corrective
- RES 4: 5568.00 High Mar 6
- RES 3: 5526.00 High Mar 19 / 20 (cont)
- RES 2: 5522.00 High Aug 22 and a key resistance
- RES 1: 5467.72 76.4% retracement of the Aug 22 - Sep 2 bear leg
- PRICE: 5386.00 @ 06:36 BST Sep 17
- SUP 1: 5372.91/5292.00 50-day EMA / Low Sep 2 and key support
- SUP 2: 5280.00 Low Aug 7
- SUP 3: 5250.02 76.4% retracement of the Aug 1 - 22 rally
- SUP 4: 5166.00 Low Aug 1 and key support
Eurostoxx 50 futures have recently traded through the 20-day EMA - a bullish development for now. The move higher undermines a recent bearish theme and signals potential for a climb towards 5522.0, the Aug 26 high and a bull trigger. On the downside, key support has been defined at 5292.00, the Sep 2 low. Clearance of this level is required to reinstate a bearish theme. For now, yesterday’s move down appears corrective.
E-MINI S&P: (Z5) Bulls Remain In The Driver’s Seat
- RES 4: 6750.50 2.000 proj of the Aug 20 - 28 - Sep 2 price swing
- RES 3: 6748.50 1.236 proj of the Aug 1 - 15 - 20 price swing
- RES 2: 6712.33 1.764 proj of the Aug 20 - 28 - Sep 2 price swing
- RES 1: 6700.00 Round number resistance
- PRICE: 6665.75 @ 07:22 BST Sep 17
- SUP 1: 6559.62 20-day EMA
- SUP 2: 6506.50 Low Sep 5
- SUP 3: 6452.53 50-day EMA
- SUP 4: 6417.25 Low Aug 12
A bull cycle in S&P E-Minis remains intact and the contract is trading closer to its recent highs. A fresh cycle high yesterday reinforces current bullish conditions. The move higher confirms a resumption of the primary uptrend and maintains the bullish price sequence of higher highs and higher lows. Sights are on the 6700.00 handle next and 6712.33, a Fibonacci projection. On the downside, initial support to watch is 6569.89, the 20-day EMA.
COMMODITIES
BRENT TECHS: (X5) Trading Below Resistance
- RES 4: $79.16 - 2.618 proj of the Apr 9 - 23 - May 5 price swing
- RES 3: $77.28 - 2.382 proj of the Apr 9 - 23 - May 5 price swing
- RES 2: $76.39 - High Jun 23 and a bull trigger
- RES 1: $69.53/71.93 - High Sep 2 / High Jul 30 and a key resistance
- PRICE: $68.43 @ 07:04 BST Sep 17
- SUP 1: $64.50 - Low Jun 30 and a key short-term support
- SUP 2: $60.82 - Low May 30
- SUP 3: $58.37 - Low May 5
- SUP 4: $57.81 - Low Apr 9 and a key support
Brent futures remain above their recent lows. Short-term gains are for now, considered corrective and a bear cycle remains intact. Sights are on $64.50, the Jun 30 low, where a clear break would confirm a continuation of the bear leg. This would open $60.82, the May 30 low. Key short-term resistance has been defined at $71.93, the Jul 30 high. Clearance of this level is required to cancel a bear theme.
WTI TECHS: (V5) Gains Considered Corrective
- RES 4: $77.85 - 2.794 proj of the Apr 9 - 23 - May 5 price swing
- RES 3: $75.65 - 2.500 proj of the Apr 9 - 23 - May 5 price swing
- RES 2: $74.25 - High Jun 23 and a bull trigger
- RES 1: $66.03/69.36 - High Sep2 / High Jul 30 and key resistance
- PRICE: $64.38 @ 07:19 BST Sep 17
- SUP 1: $61.29 - Low Aug 13 and the bear trigger
- SUP 2: $57.71 - Low May 30
- SUP 3: $54.80 - Low May 5
- SUP 4: $54.03 - Low Apr 9 and a key support
The trend condition in WTI futures is unchanged - a bear cycle remains intact and the latest recovery is considered corrective. The pullback from the Sep 2 high highlights a possible recent reversal and the end of a corrective phase between Aug 13 - Sep 2. Initial resistance to watch is $66.03, the Sep 2 high. Key short-term resistance has been defined at $69.36, the Jul 30 high. A stronger resumption of weakness would open $57.71, the May 30 low.
GOLD TECHS: Trend Needle Points North
- RES 4: $3783.2 - 1.618 proj of the Dec 30 ’24 - Apr 3 - 7 price swing
- RES 3: $3744.2 - 1.500 proj of the May 15 - Jun 16 - 30 price swing
- RES 2: $3705.2 - 1.382 proj of the May 15 - Jun 16 - 30 price swing
- RES 1: $3703.1 - High Sep 16
- PRICE: $3677.8 @ 07:24 BST Sep 17
- SUP 1: $3614.0 - Low Sep 11
- SUP 2: $3547.7 - 20-day EMA
- SUP 3: $3449.3 - 50-day EMA
- SUP 4: $3311.6 - Low Aug 20
Gold remains in a clear bull cycle and the yellow metal is trading at its recent highs. A fresh all-time high, once again this week, confirms a resumption of the primary uptrend and an extension of the sequence of higher highs and higher lows. The next objective is $3705.2, a Fibonacci projection. Initial firm support lies at $3547.7, the 20-day EMA. Note that moving average studies are in a bull-mode position, highlighting a dominant uptrend.
SILVER TECHS: Corrective Pullback
- RES 4: $43.272 - 2.500 proj of the Jul 31 - Aug 14 - 20 price swing
- RES 3: $43.000 - Round number resistance
- RES 2: $42.974 - 2.382 proj of the Jul 31 - Aug 14 - 20 price swing
- RES 1: $42.972 - High Sep 16
- PRICE: $41.883 @ 8:12 BST Sep 17
- SUP 1: $40.635 - 20-day EMA
- SUP 2: $39.042 - 50-day EMA
- SUP 3: $36.965 - Low Aug 20
- SUP 4: $36.216 - Low Jul 31 and a key support
Trend signals in Silver remain bullish and the latest pullback is considered corrective. The metal traded higher last Friday, delivering a fresh cycle high. The extension earlier this week confirms a resumption of the uptrend and maintains the price sequence of higher highs and higher lows. MA studies are in a bull-mode position, reinforcing current conditions. Sights are on $42.974 next, a Fibonacci projection. Support to watch is $40.635, the 20-day EMA.


