EQUITY TECHS: E-MINI S&P: (U5) Bullish Trend Conditions
- RES 4: 6402.44 1.382 proj of the May 23 - Jun 11 - 23 price swing
- RES 3: 6381.00 1.764 proj of the Apr 7 - 10 - 21 price swing
- RES 2: 6356.12 1.236 proj of the May 23 - Jun 11 - 23 price swing
- RES 1: 6343.00 High Jul 15
- PRICE: 6306.25 @ 14:34 BST Jul 18
- SUP 1: 6241.00 Low Jul 16
- SUP 2: 6226.62/6082.03 20- and 50-day EMA values
- SUP 3: 5811.50 Low May 23
- SUP 4: 5645.75 Low May 7
S&P E-Minis are still trading in a range, closer to their recent highs. The trend condition remains bullish. Recent activity has resulted in a break of resistance at 6128.75, the Jun 11 high. The breach confirmed a resumption of the uptrend that started Apr 7. This was followed by a break of key resistance and a bull trigger at 6277.50, the Feb 21 high. Sights are on 6356.12, a Fibonacci projection. Key support is at the 50-day EMA, at 6082.03.
Want to read more?
Find more articles and bullets on these widgets:
Historical bullets
EQUITY TECHS: E-MINI S&P: (U5) Trend Condition Remains Bullish
- RES 4: 6200.00 1.500 proj of the Apr 7 - 10 - 21 price swing
- RES 3: 6172.50 High Feb 24
- RES 2: 6134.00 High Feb 26
- RES 1: 6128.75 High Jun 11 and the bull trigger
- PRICE: 6070.25 @ 14:31 BST Jun 17
- SUP 1: 5979.00/5890.99 Low Jun 13 / 50-day EMA
- SUP 2:5811.50 Low May 23
- SUP 3: 5645.75 Low May 7
- SUP 4: 5500.00 Low Apr 30
The trend condition in S&P E-Minis is unchanged, it remains bullish and the contract traded to a fresh cycle high last Wednesday, reinforcing current bullish conditions. For now, the most recent pullback is considered corrective. The contract has pierced support at 6000.18, the 20-day EMA. A clear breach of this average would expose the 50-day EMA, at 5890.99. Key short-term resistance has been defined at 6128.75, the Jun 11 high.
SOFR OPTIONS: BLOCK: Dec'25 SOFR Call Condor Sale
- -9,000 SFRZ5 97.00/97.25/97.75/98.00 call condors, 0.75 ref 96.09.5 at 0926:18ET
US DATA: Import Prices Show Most Exporters Didn’t Take Tariff “Hit” In Apr/May
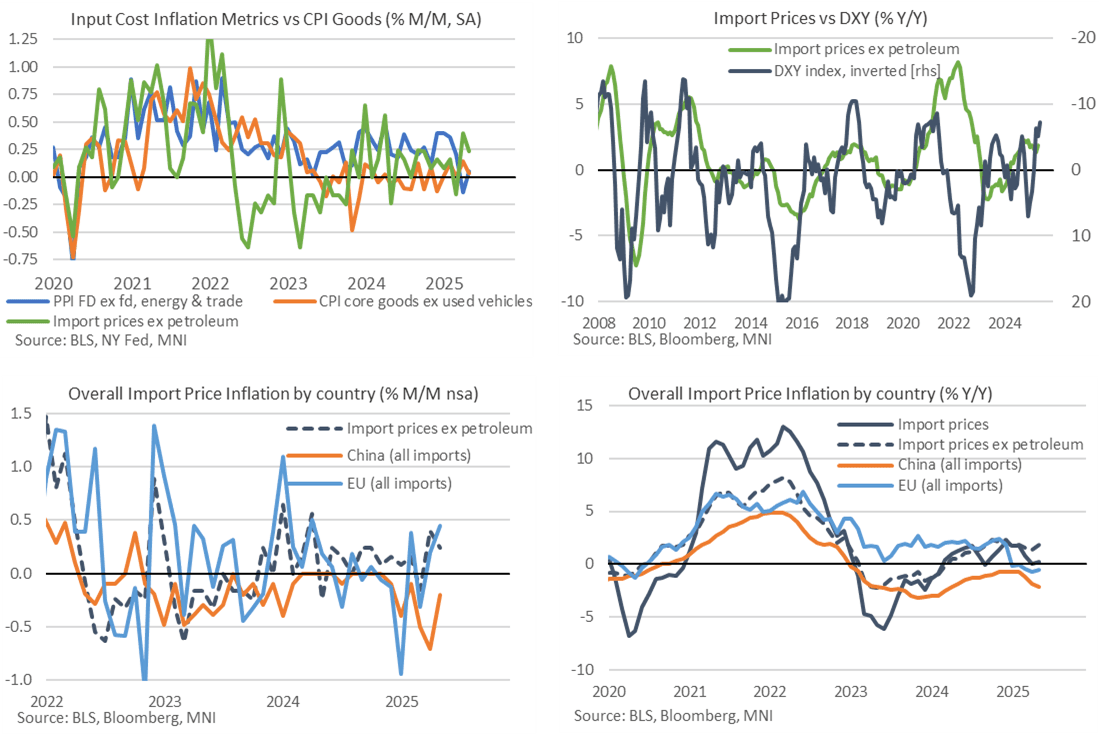
- Import prices were a little stronger than expected in May at 0.0% M/M (cons -0.2) after 0.1% in April whilst ex petroleum prices increased 0.2% M/M (cons 0.1) after 0.4% in April.
- For ex-petroleum prices, it’s a solid increase after the 0.4% in April was its strongest in twelve months. It saw the Y/Y accelerate from 1.36% to 1.8% Y/Y for its highest since February and with some further increases possible judging by USD weakness - see charts below.
- Whilst these data do not take account of tariffs (which are considered taxes in the national accounts), they importantly point to little sign of exporters taking part of the “hit” of US tariffs in the form of lowering their prices to remain more competitive against countries with lower tariff rates.
- That’s on a widespread basis, and likely a factor of the baseline ‘reciprocal’ 10% tariff rates seen for many countries during the current 90-day pause. There are however signs of some discounting from those that have been targeted more heavily, with China a clear standout.
- For example, overall import prices from China fell -0.2% M/M in May after a heavy -0.7% M/M in April whereas prices from the EU increased 0.4% M/M after 0.2% M/M.
- Overall declines in Canada (-1.0%) and Mexico (-0.3%) have to be taken with caution, as this was driven by fuel prices, with non-manufacturing import prices +0.7% M/M from Canada and 0.0% M/M from Mexico.
- China import price inflation stands at -2.1% Y/Y (weakest since Apr 2024) whilst EU import price inflation lifted from -0.8% to -0.5% Y/Y after what had been its weakest since May 2020.
