US TSYS: Asia Wrap - Yields Retrace Some Of Friday's Moves
The TYU5 range has been 112 to 112-12 during the Asia-Pacific session. It last changed hands at 112-03+, down 0-03 from the previous close.
- The US 2-year yield has bounced off Friday’s lows trading around 3.696%, up 0.01 from its close.
- The US 10-year yield has also bounced off Friday’s lows trading around 4.241%, up 0.03 from its close.
- (Bloomberg) -- “A block of 2,300 contracts in 10-year bond September futures traded at a price of 114-03 on CBOT. A total of 53,897 contracts traded so far in this session.” There were also multiple block trades executed in both the five-year and two-year contracts.
- The 10-year yield had a powerful move lower in reaction to the NFP data, breaking below its 4.30% pivot within the wider range 4.10% - 4.65%. This now turns momentum lower in yields and you could expect buyers of treasuries on bounces back towards 4.30/35% now looking to initially test the 4.10% area. The move was even more aggressive in the 2-year which has rejected the move back towards 4% and now looks to target the pivotal 3.50% area.
- Wei Li(CIS BlackRock) on LinkedIn: “I don’t envy Powell, the Fed challenge is real:
- Slower growth - we had expected tariffs to slow US growth to about HALF its potential, and now it looks like the economy is already there. 3-month average payroll gains of just 35k is below our breakeven estimate of 60-80k, that accounts for demographics and softening immigration flows. Tariffs and trade are distorting other data such as gdp, but it is less the case with labour data/nfp.”
- “Persistent inflation pressure - average hourly earnings rose on the month, puzzlingly strong given weak job creation, although partly attributable to slower immigration crimping labour supply. Furthermore, tariffs are starting to feed through and could further push up goods prices.”
- CrossBorder Capital on X: “US Treasuries looking pretty stable despite the noise!? Term premia decoupling favorably from RoW. Zero evidence of loss of safe haven quality.”
- Data/Events: Factory Orders, Durable Goods
Fig 1: 10-Year US Yield 120min Chart
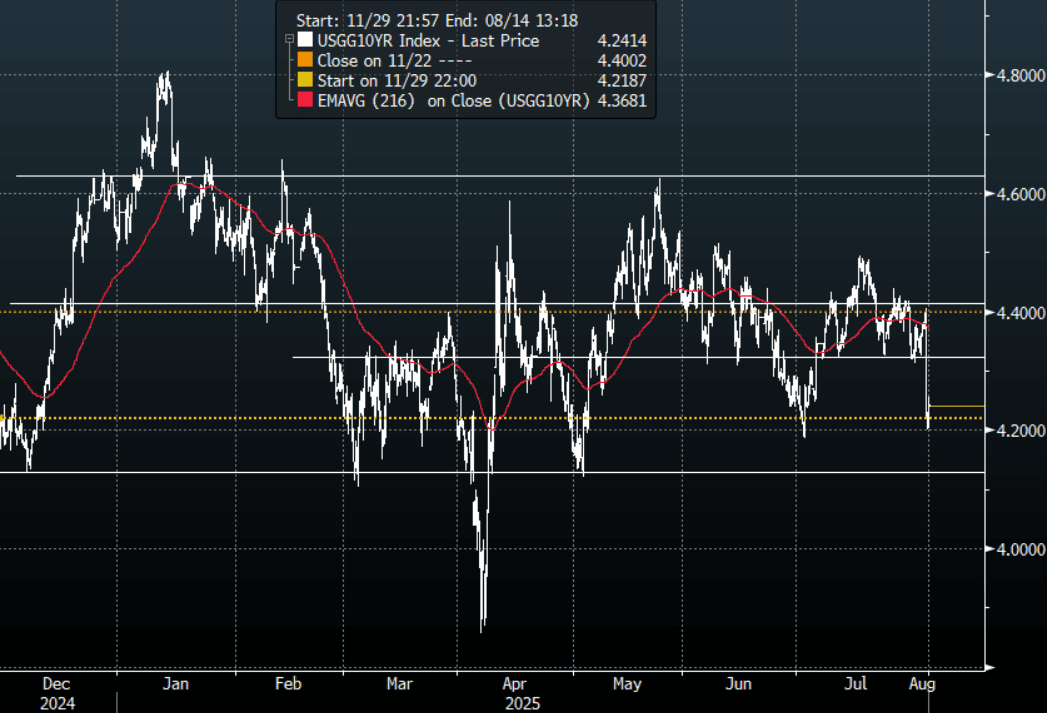
Source: MNI - Market News/Bloomberg Finance L.P
Want to read more?
Find more articles and bullets on these widgets:
Historical bullets
USDCAD TECHS: Trend Outlook Remains Bearish
- RES 4: 1.4111 High Apr 4
- RES 3: 1.4016 High May 12 and 13 and a key resistance
- RES 2: 1.3920 High May 21
- RES 1: 1.3674/3776 20- and 50-day EMA values
- PRICE: 1.3607 @ 16:12 BST Jul 4
- SUP 1: 1.3557 Low Jul 03
- SUP 2: 1.3540 Low Jun 16 and the bear trigger
- SUP 3: 1.3503 1.618 proj of the Feb 3 - 14 - Mar 4 price swing
- SUP 4: 1.3473 Low Oct 2 2024
The trend needle in USDCAD points south and this week’s move down reinforces current conditions. S/T gains between Jun 16 - 23 appear to have been corrective. Key support and the bear trigger is 1.3540, Jun 16 low. Clearance of this level would resume the downtrend and open 1.3503, a Fibonacci projection. Pivot resistance is at the 50-day EMA, at 1.3776. A clear break of this average would signal scope for a stronger recovery.
AUDUSD TECHS: Bull Cycle Remains In Play
- RES 4: 0.6700 76.4% retracement of the Sep 30 ‘24 - Apr 9 bear leg
- RES 3: 0.6688 High Nov 7 ‘24
- RES 2: 0.6603 High Nov 11 ‘24
- RES 1: 0.6590 High Jul 01
- PRICE: 0.6548 @ 16:05 BST Jul 04
- SUP 1: 0.6521 20-day EMA
- SUP 2: 0.6468/6373 50-day EMA / Low Jun 23 and a reversal trigger
- SUP 3: 0.6357 Low May 12
- SUP 4: 0.6275 Low Apr 14
The trend set-up in AUDUSD remains bullish and the pair is holding on to its recent gains. The latest break higher maintains the bullish price sequence of higher highs and higher lows, the definition of an uptrend. Moving average studies are in a bull-mode position, highlighting a dominant uptrend. Sights are on 0.6603 next, the Nov 11 2024 high. Key short-term support has been defined at 0.6373, the Jun 23 low.
EURJPY TECHS: Northbound
- RES 4: 171.88 High Jul 19 ‘24
- RES 3: 171.28 1.382 proj of the Feb 28 - Mar 18 - Apr 7 price swing
- RES 2: 171.09 High Jul 23 ‘24
- RES 1: 170.61 High Jul 03
- PRICE: 170.22 @ 16:04 BST Jul 04
- SUP 1: 169.04 Low Jul 02
- SUP 2: 167.87 20-day EMA
- SUP 3: 167.13 Low Jun 20
- SUP 4: 165.66 50-day EMA
EURJPY traded higher on Thursday resulting in a print above 170.47, the 76.4% retracement of the Jul 11 - Aug 5 sell-off. A clear break of this price point would strengthen bullish conditions and signal scope for extension. This would open 170.28 next, a Fibonacci projection. The trend is overbought, a pullback would unwind this condition. Support to watch lies at 167.87, the 20-day EMA.